Category: Product Releases

  • Visiopharm software updates: 2025.08.1

    A new Release of the Visiopharm Platform has arrived and there’s a load of improvements we want to tell you about. This is the 2025.08.x Release, which is available in August 2025, and our last Release was the 2025.02.x which was available in February 2025. Continue reading to find out what’s been updated.

    What’s new

    Quickstart APPs

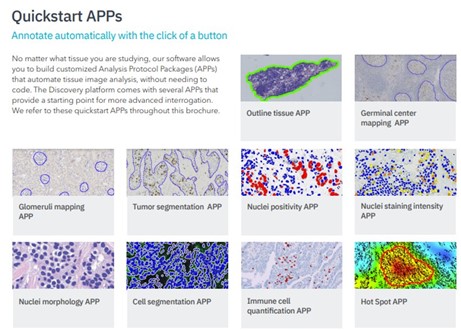
    Quickstart APPs can provide the starting point for building many different APP workflows such as 1) Outlining tissue, 2) Tumor segmentation and or 3) Nuclei positivity. The Quickstart APPs can be modified and retrained to work with different studies and are therefore an advantage when initiating new projects.

    A few examples are shown below, and further information can be found here:
    Quickstart APPs

    Replacing measurement tool with existing annotation tool

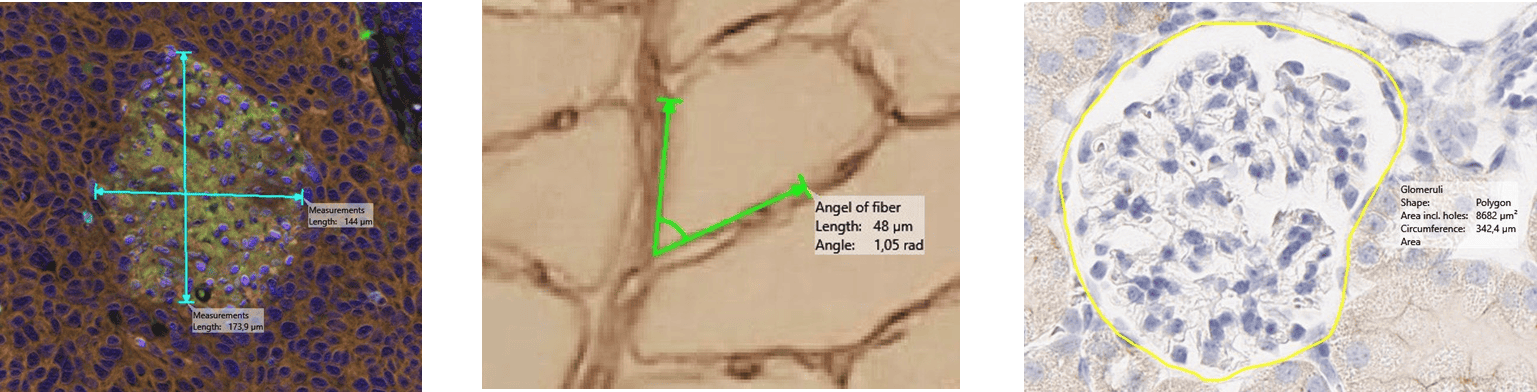
    The measurement tool has been replaced with our existing annotation tool where angle, area and length measurements can be obtained. Annotation results can be obtained directly from the APP author where annotations can be output as a result which also can be used in batch processing.
    Annotation tools

    Color adjustment – fusing of images

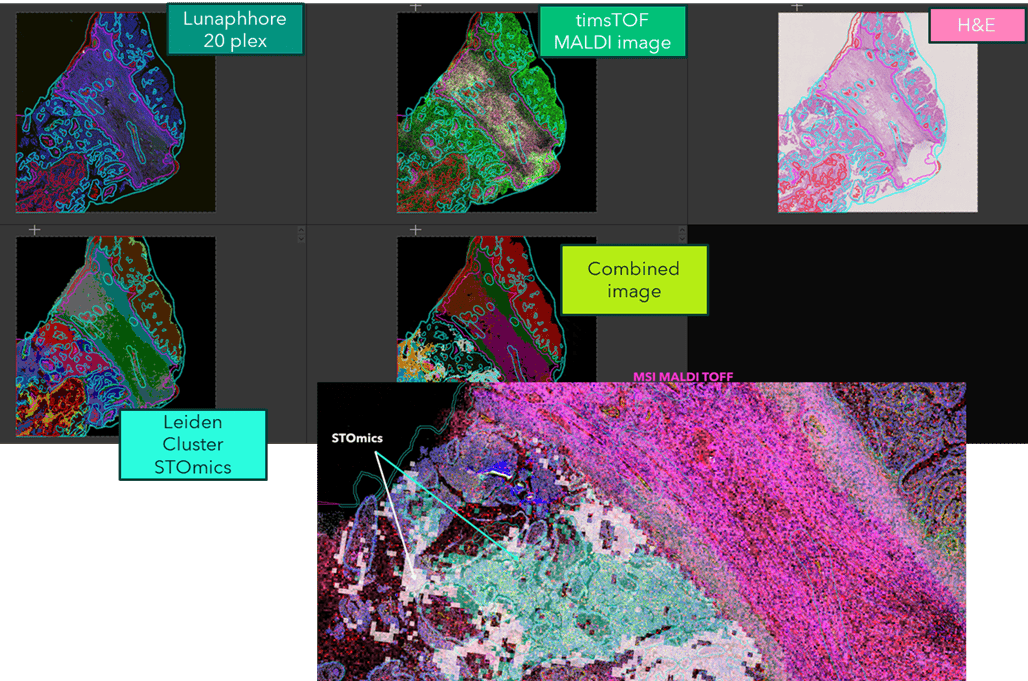
    Fusing of images are now available, where multiple images can be fused together by Tissuealign. All channels are now visible in 1 single list under color adjustment tab for the combined image.
    Color adjustment

    General

    Additionally, it is now possible to link two images together and make a quick overlay of the channels without stretching the image or doing alignment in the Tissuealign module. Furthermore, comparing images with the same image settings can be done in color adjustment by setting the dynamic range. The heatmap is improved by removing the blue background label and thereby simplify the heatmap overview.

    Deployed versions of Visiopharm Platform

    As part of our ongoing commitment to performance, security, and innovation, we will be discontinuing support for the 32-bit version of the Visiopharm Platform by Summer 2026.

    Starting from that date, only the 64-bit version will be available and supported. This transition will allow us to deliver enhanced capabilities, improved speed, and better compatibility with modern systems.

    If you are currently using the 32-bit version, we recommend upgrading to the 64-bit version as soon as possible. Our support team is available to assist with the transition and answer any questions you may have.

    Specifically, the 2025.08.x versions will be the last versions with technical support, fixes and patch versions to both 32-bit and 64-bit. This support for the 2025.08.x versions will remain until August 2026.

    Any new functionality in the Visiopharm Platform will be available in versions higher than 2025.08.x, only in 64-bit.

    We appreciate your understanding and continued support. If you have any concerns or need help with the upgrade, please don’t hesitate to contact our support team.

    For Customers only

    Get more information about the changes in our release notes and access this version on the download page.

    Please note that this release is for research use only

    If you’re unable to download the update, please reach out to our support team.
  • Visiopharm software updates: 2025.02.1

    The latest version of our software has arrived and there’s a load of improvements we want to tell you about. We have created a short video to walk you through all the updates – watch it now to see what’s new!

    Prefer to read? Keep scrolling to explore the key enhancements.

    What’s new

    PhenoplexTM Guided Workflow

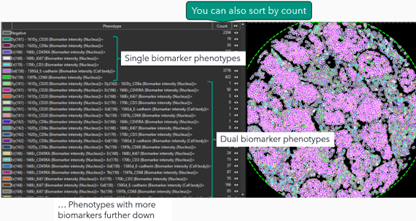
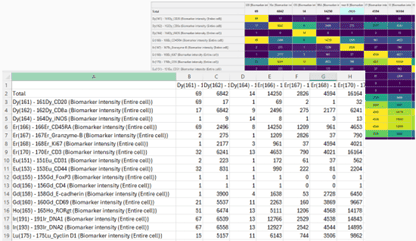
    This release includes the possibility to sort the phenotype list by biomarker count and extraction of the co-occurrence matrix data.

    It also includes improved loading of data in the Phenoplex Guided Workflow.

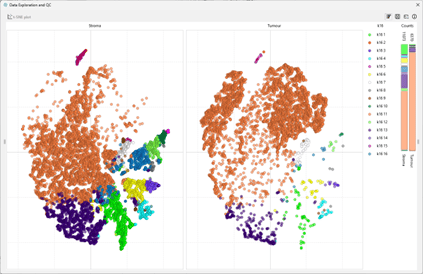
    Data exploration and QC tool

    K-means clustering is available for the t-SNE plot and the tool is now dockable like many of the other dialogues and tools in the software.

    General

    Additionally, the color adjustment is improved for multi-view of images, the heatmap is improved and there are new file formats and layer data that is supported in Visiopharm.

    Get more information about the changes in our release notes and access this version on the download page.

    Please note that this release is for research use only

    If you’re unable to download the update, please reach out to our support team.
  • Phenoplex v3: Revolutionizing multiplex image analysis with advanced spatial neighborhood capabilities  

    Phenoplex v3: Revolutionizing multiplex image analysis with advanced spatial neighborhood capabilities  

    We are excited to launch Phenoplex v3, the latest iteration of our complete workflow for all your multiplex image analysis needs.

    With an emphasis on empowering researchers with unprecedented insights into spatial relationships, Phenoplex v3 introduces groundbreaking features for spatial neighborhood analysis, allowing users to define custom radii and quantify and visualize specific cellular neighbors. 

    Come visit us at SITC booth #716 to see a live preview of the new spatial neighborhood analysis features. 

    Key new features of Phenoplex v3 putting spatial analyses at your fingertips: 

    Proximity Profiling:  

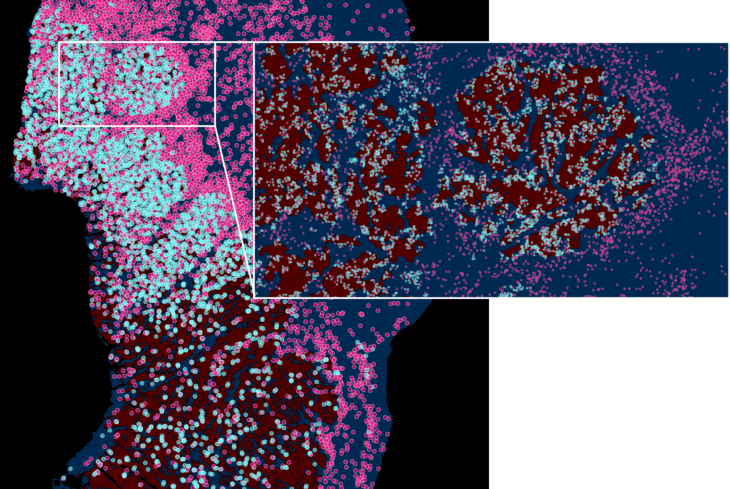
    Phenoplex v3 puts control in the hands of researchers with the ability to define cell population targets and Regions of Interest for analysis. Cell neighbors are selected and custom distance radii around targets can be set. Users can now select relevant cell populations for analysis and display targets and neighbors on their images interactively. This novel feature empowers users to tailor their analyses with unparalleled precision, ensuring that the spatial relationships within user-defined areas are thoroughly examined – spatial biology hypothesis review at a new level.

    Review cellular neighbors on your whole slide images with ease
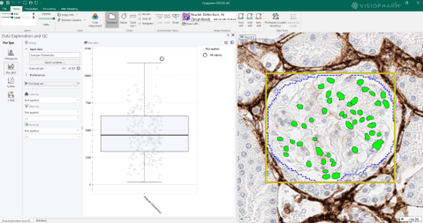
    Analyse neighboring cells in individual Regions of Interest (ROIs)

    Cross-Population Distance Analysis:  

    Unlock the potential of your multiplex imaging data with Phenoplex v3’s spatial distance analysis. Explore intricate cellular interactions and uncover hidden patterns within tissues and across samples. The intuitive interface simplifies the process, making distance analyses accessible both to experienced users and newcomers, for distances of cell populations to each other cells or to specific Region borders.

    Seamless Workflow Integration: Efficiency Redefined  

    Phenoplex v3 seamlessly integrates into your existing workflow, streamlining the analysis process and saving valuable time. The intuitive user interface, coupled with user-friendly features, ensures a hassle-free experience from data input to insightful results.  

    Paving the Way for Future Discoveries: Stay Ahead in Research  

    With Phenoplex v3, researchers can stay ahead in the dynamic field of multiplex image analysis. The innovative features offered by Phenoplex v3 open new avenues for exploration, helping scientists make groundbreaking discoveries and contribute to the advancement of knowledge.  

    Visiopharm remains committed to providing cutting-edge solutions that empower researchers to unravel the complexities of biological systems. Phenoplex offers you:  

    • A guided bi-directional workflow tailored for setting phenotypes with continuous QC and review of results.  
    • Advanced fully interactive Data Exploration, using t-SNE, Scatter and Box-plotting capabilities along with a cell gallery and cell locations across multiple images  
    • Powerful pre-trained nuclear detection APPs for multiplex immunofluorescence and IMC (imaging mass cytometry).  
    • Easy-to-use channel management tools to QC images and review biomarker localization. Group your channels of interest in multiple meaningful color channel groups to quickly toggle between panels.  
    • A workflow to review and set image object thresholds for each biomarker manually or automatically.  
    • A novel graphical co-occurrence matrix overview to review biomarker double positivity combinations; users with domain knowledge now have an intuitive way to spot unexpected combinations.  
    • Powered by Visiopharm’s best-in-class image analysis platform, combining 20 years of tissue expertise with innovative state-of-the-art technology.  

    Janusz Franco-Barraza, MD, PhD, Research Assistant Professor (E. Cukierman Lab) & Manager of Spatial Immuno-Proteomics Facility at Fox Chase Cancer Center:

    Visiopharm’s Phenoplex workflow allowed me, as a cancer biologist, to effectively scrutinize high-plex immunofluorescence images of pancreatic cancer, investigating a large panel of markers and uncovering the spatial relationships of cell populations, despite being a naive user. This user-friendly platform bridges the gap between basic and translational research, representing the future of cancer cell biology.

    Dr. Fabian Schneider, Visiopharm Research Product manager:

    We’ve learned from our customers and partners that image analysis of highplex assay (>10 channels) has advanced needs that range from how to work with channel management tools, to image object thresholding and clear presentation of biomarker combinations as phenotypes. We have partnered with our users to develop an end-to-end product solution for the analysis of highplex assay imagery. Phenoplex provides researchers with a workflow from dataset management, image object generation using powerful AI APPs, development of channel rules for positivity thresholds, bi-directional data interaction using advanced plotting capabilities, and now advanced spatial neighborhood analysis. With this, we enable researchers, irrespective of their experience with image analysis software or their programming skills, to generate a phenotyping data library and to deep dive into the biology of their datasets.

    For more information about Phenoplex, please visit our website or book a demo of the new features.