Category: Blog

  • Alimentiv’s digital pathology innovation with Visiopharm: an interview with Dr. Pavine Lefevre

    Alimentiv’s digital pathology innovation with Visiopharm: an interview with Dr. Pavine Lefevre

    Alimentiv is at the forefront of delivering digital pathology solutions through its combination of a state-of-the-art specialty histology laboratory, AcelaBio, and digital image analysis services, powered by Visiopharm® software. This end-to-end offering of high-quality sample processing and quantitative biomarker analysis provides our clients with robust insights into histopathology, drug mechanisms of action, target engagement, and pharmacodynamics.

    In this recent interview, Alimentiv’s Lead Scientist, Pavine Lefevre PhD, shared her insights on Alimentiv’s histopathology services and the advantages of the Visiopharm® platform.

    Dr. Pavine Lefevre is a distinguished scientist specializing in precision medicine and digital pathology. She currently serves as the Lead Scientist at Alimentiv, a contract research organization focused on gastrointestinal diseases. With over 10 years of experience collaborating with clinicians, scientists, and pharmaceutical organizations, Dr. Lefevre oversees translational research exploring histopathology, drug mechanisms of action, pharmacodynamics, and pharmacokinetics. She utilizes cutting-edge technologies in molecular and cellular biology, customizing approaches based on client needs to ensure the success of clinical trials and ultimately improve human health. 

    Dr. Pavine Lefevre, Lead Scientist at Alimentiv
    Visiopharm: Can you tell us about Alimentiv, your services, and how you differentiate yourself from other CROs?

    Dr. Pavine Lefevre: Alimentiv is a specialized CRO driving innovation in clinical trials for inflammatory bowel disease (IBD) and other GI conditions, such as celiac disease and eosinophilic esophagitis. We provide comprehensive support for drug development, guided by leading gastroenterologists and scientists. Alimentiv delivers exceptional medical imaging expertise, supporting endoscopic and histopathological scoring for critical clinical trial data. In combination with our specialty CAP/CLIA-certified laboratory, AcelaBio, we offer seamless end-to-end workflows for GI tissue biopsy analysis. This includes spatial transcriptomics, multiplex immunofluorescence, digital pathology, and advanced image analysis. We not only support exploratory endpoints in clinical trials but also drive internal research to deepen our understanding of IBD histopathology, ultimately accelerating drug development and improving patient outcomes.

    Visiopharm: What problems were you trying to solve when you started working with us compared with previous analysis software, and how did Visiopharm help you overcome those challenges?

    Dr. Pavine Lefevre: Initially, we relied on external vendors for digital image analysis, a valuable step in our early development. However, to enhance our capabilities and streamline our workflow, particularly after establishing AcelaBio as our in-house histopathology laboratory offering advanced staining techniques like multiplex IHC/IF, we decided to bring digital image analysis in-house. Quantitative image analysis, under pathologist oversight, was crucial for achieving precise measurements and tackling complex research questions.

    Visiopharm: What specific features of our software do you find most helpful?

    Dr. Pavine Lefevre: Visiopharm’s Author module allows us to develop highly customized, high-performance algorithms (“APPs”) by offering exceptional flexibility in parameter and setting selection. The introduction of the AI Author module, featuring deep learning-based classification, has changed our analysis capabilities, delivering robust and precise results.

    Visiopharm: Can you share a specific case study where Visiopharm’s software helped you solve a particularly challenging problem in your research or analysis?

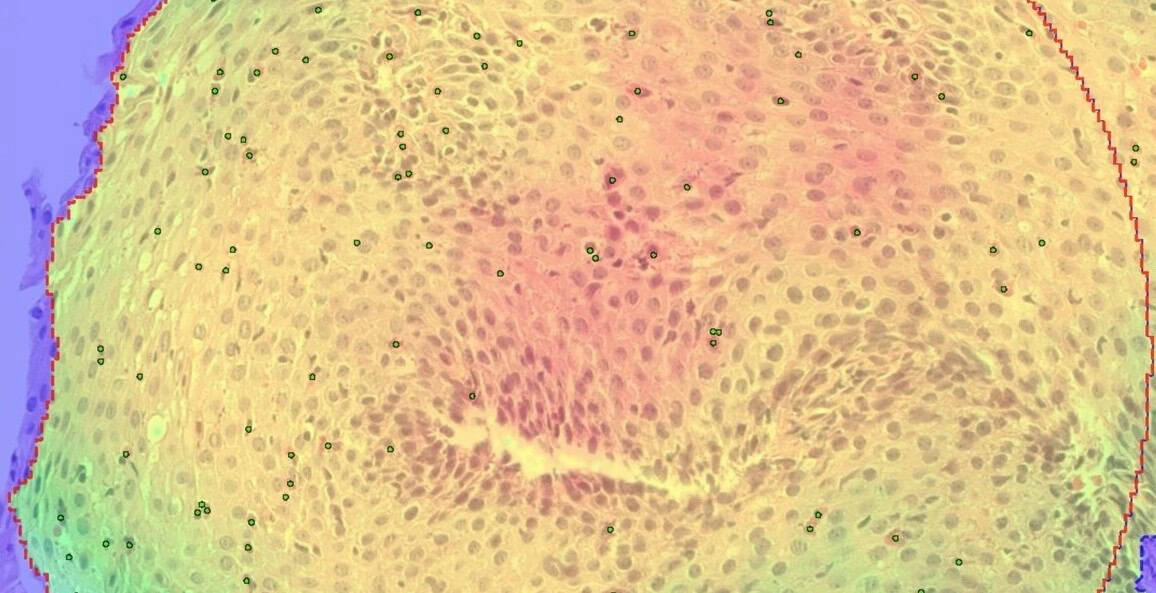
    Dr. Pavine Lefevre: Last year at Digestive Disease Week (DDW), we presented our digital pathology analysis algorithm designed to automate peak eosinophil count (PEC) quantification in eosinophilic esophagitis biopsies (Figure 1). This project aimed to create a computer-aided tool to assist pathologists in accurately quantifying PEC from whole slide images of H&E-stained esophageal biopsies in clinical trials. We collaborated with Drs. Evan Dellon (UNC) and Arjan Bredenoord (Amsterdam UMC), who provided esophageal biopsy images for algorithm training and development. The images were manually annotated by pathologists and used to train and develop an eosinophil counting APP with Visiopharm.  

    The algorithm was developed and iteratively refined, through validation, to accurately: detect the tissue area, detect and count eosinophils across the entire tissue section, and precisely identify and count eosinophils within a 40x high-powered field hotspot, representing areas of peak eosinophil density. Validation via Sensitivity Assessment of the APP demonstrated a strong correlation between the APP’s automated PEC and pathologist manual counts (Spearman r = 0.9895). We aim to use this APP to facilitate augmented reading in the near future.
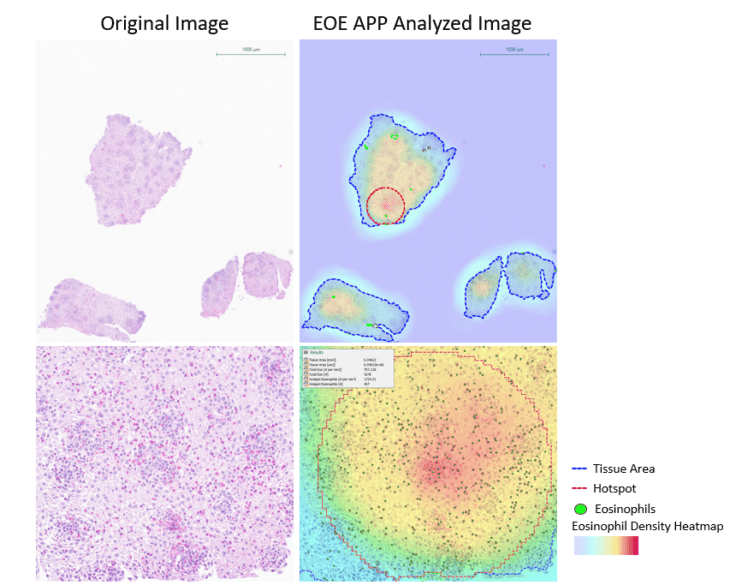
    Figure 1. The original images (left) represent H&E-stained esophageal tissue sections. The EOE APP analyzed images (right) show the original image overlaid with the EOE APP generated images.
    Visiopharm: Could you share some insights into how the software has added value to your business and your customers?‌‌ 

    Dr. Pavine Lefevre: Acquiring Visiopharm software has enabled us to expand our business capabilities, allowing us to offer a seamless, end-to-end digital pathology solution from biopsy processing to sophisticated image analysis.

    Visit Alimentiv’s website to learn how our precision medicine services can advance your research. Discover our comprehensive services, advanced technology, and proven expertise.

    Learn more about Visiopharm software here.

    About Alimentiv, Inc.

    Alimentiv is a leading specialty GI-focused CRO, advancing frontiers of gastrointestinal (GI) clinical trials and medical research since 1986. As a global CRO offering clinical, medical imaging and precision medicine services, Alimentiv partners with pharmaceutical and biotechnology industries to advance the development of novel therapies and accelerate their time to market. Alimentiv is headquartered in London, Ontario, Canada, with a global footprint across its operations in Canada, the United States, Europe, Asia-Pacific, and Latin America. For more information, visit www.alimentiv.com.

    About Visiopharm

    Visiopharm is a leading provider of AI-driven precision pathology software for research and diagnostics. In research, it is a technology leader providing tools that help scientists, pathologists, and image analysis experts produce accurate data for all types of tissue-based research. In diagnostics, it is a leader within clinical applications, with no fewer than nine diagnostic algorithms cleared under IVDR for EU and UK customers. These applications provide diagnostic decision support and can be easily activated and integrated into existing lab workflows. Founded in 2002, Visiopharm is privately owned and operates internationally with over 750 customer accounts in more than 40 countries. The company’s headquarters are located in Denmark’s Medicon Valley, with legal entities in Sweden, the UK, Germany, the Netherlands, and the United States, and local representation in France and China.

  • Improving bladder cancer grading with AI-driven image analysis: A conversation with Prof. David Berman

    Improving bladder cancer grading with AI-driven image analysis: A conversation with Prof. David Berman

    As part of our Discovery Stories: People Behind Discovery series, we had the privilege of speaking with Professor David Berman, a leading researcher focused ​on developing​​ high-impact cancer tests for prostate and bladder cancer patients. In this interview, Prof. Berman shares insights into his team’s efforts to ​improve​​ bladder cancer grading. By using Visiopharm’s AI-driven software, they are automating the analysis of millions of nuclei, creating more accurate and objective grading systems​, and tuning them to better predict patient outcomes​. He also discusses how these advancements will advance the field of pathology and enhance clinical decision-making.

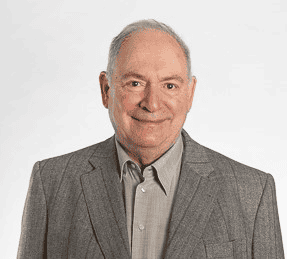
    Prof. David Berman

    Dr. David M. Berman (Principal Investigator and Professor at Queen’s University in Kingston, Ontario) leads a research group developing high-impact cancer tests for prostate and bladder cancer. The team identifies novel biomarkers and therapeutic targets to improve patient outcomes by integrating data from genomic databases, experimental studies, and curated human biospecimens. This approach yields personalized management strategies tailored to each patient.

    Read on or watch the video to learn how Visiopharm’s tools empower Prof. Berman and his team to push the boundaries of cancer research and diagnostics.

    Visiopharm: What is the primary focus of your research?

    Prof. David Berman: Our project focuses on turning bladder cancer grading into an objective algorithm. Pathologists today categorize early bladder cancer into low-grade and high-grade; however, there’s a great deal of variability among pathologists in how grading is performed. If a patient has low-grade cancer, they are typically managed with infrequent and limited surveillance. This surveillance involves inserting a camera through the urethra to examine the bladder for new tumors. While this procedure is necessary, it is uncomfortable, expensive, and inconvenient for patients. Additionally, it places a significant financial burden on health systems, making bladder cancer one of the most expensive cancers to manage.

    In contrast, if a cancer is high-grade, the patient is offered more frequent surveillance and intensive immunotherapy, which is administered directly into the bladder. The difference between low-grade and high-grade is illustrated in the image below:

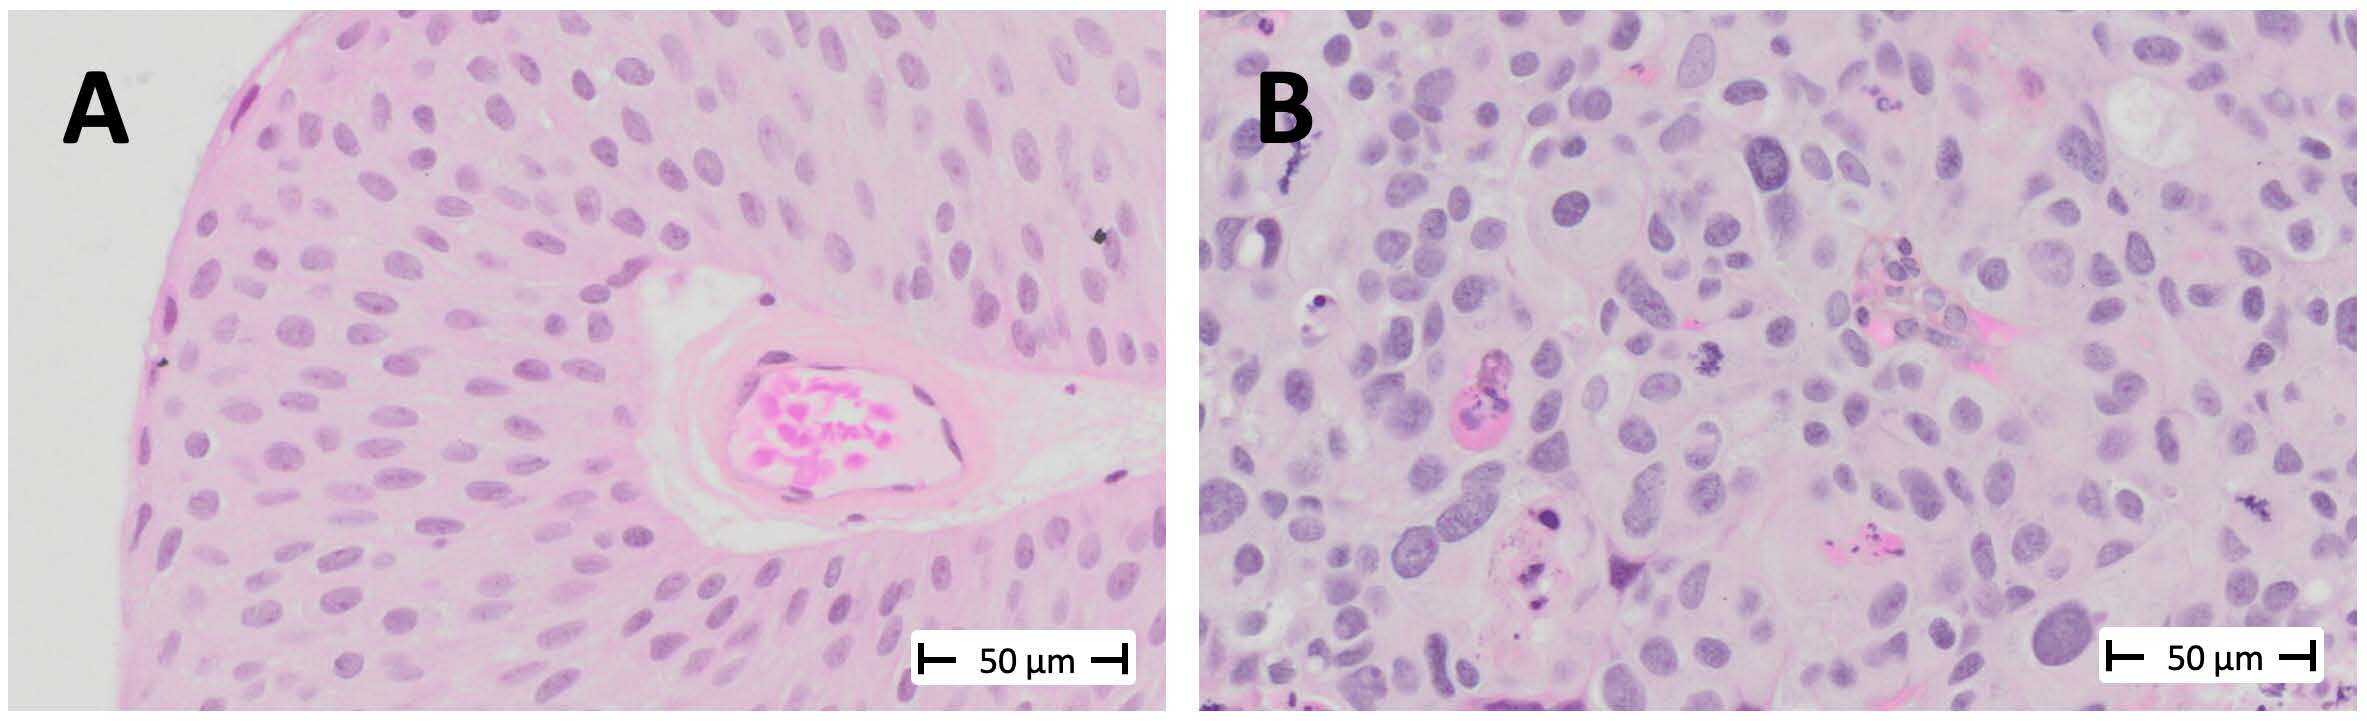
    Figure 1 – Histology of low-grade (A) and high-grade (B) non-invasive papillary urothelial carcinoma.

    Low-grade tumors have relatively uniform-looking nuclei. Most of these nuclei are oval, and they are similar in size and shape. Most of them are also oriented in such a way that it appears as though you’ve combed the nuclei from the bottom of the screen toward the top. This creates a well-organized tissue. The cells respect each other’s space and align well with each other, much like they would in the benign tissue from which this cancer arises, known as the urothelium.

    On the other hand, in high-grade cancer, the nuclei are not uniformly oval. They appear to be oriented in various directions, and you’ll notice that some are significantly larger than others. Some of the cells are undergoing mitosis, indicating rapid proliferation> These look like eyelashes or spider webs.

    Like many studies before us, we found that even the best possible agreement among expert pathologists—like me, having specialized in urologic pathology for over 20 years—is about 80%. We had experts from three different academic centers review our cases, and we discovered that the same cancer could be treated differently depending on the pathologist about a third of the time. This unacceptably high level of variability is the best we can achieve because it largely comes down to judgment. There are many complex features involved in describing the size, shape, and orientation of cells in bladder cancer, which determine whether it’s low-grade or high-grade. But these features don’t involve precise measurements or numerical values.

    For example, low-grade tumors may have occasional mitoses, while mitoses are more frequent in high-grade tumors. However, terms like “occasional” and “frequent” are subjective, and it’s unclear where to draw the line.

    This is the issue we aimed to address in our study, which we published in collaboration with Regan Baird and Dan Winkowski from Visiopharm 1.

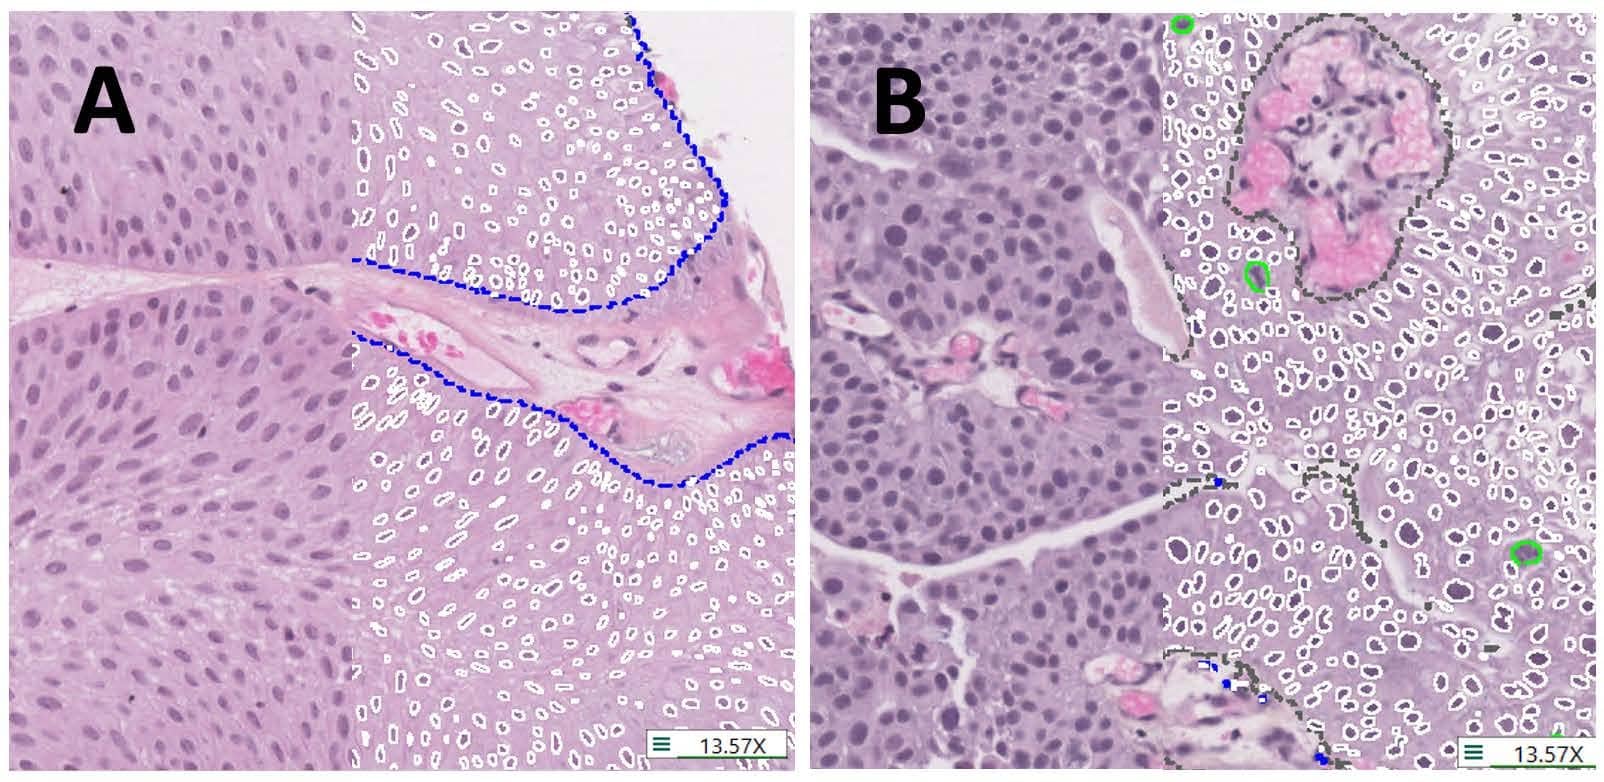
    The study, led by Ava Slotman, who was then a graduate student in the lab, is the largest study of nuclear measurements as part of cancer grading. We measured over three million nuclei from 371 cases, including 641 images. Using Visiopharm, we measured every cancer nucleus in every case. This included an automated APP that we trained to distinguish cancer tissue from benign tissue.  This process resulted in an enormous data set that we could analyze using complex algorithms to examine the differences between low-grade and high-grade tumors. Visiopharm provided us with a wide range of relevant features to explore in our analysis.

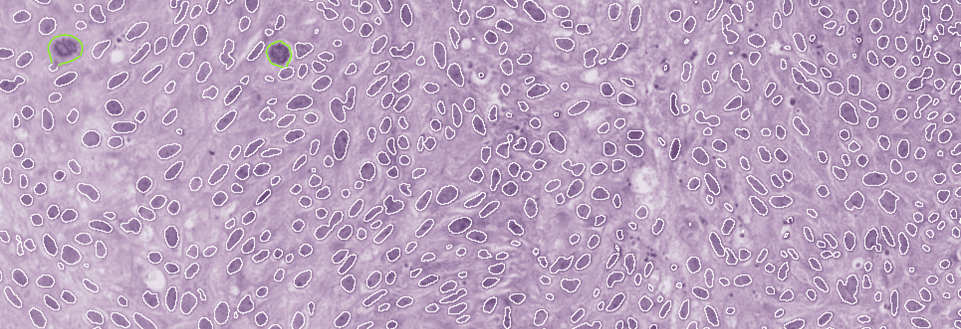
    Figure 2 – Nuclear segmentation and morphometric features analysed. Visiopharm software segments
    individual nuclei (white lines), mitotic figures (green lines) and tissue regions (blue dashes outline tumour,
    grey dashes non-tumour). A. Histology representative of low-grade. B. Histology representative of high-grade.

    We found that the most informative single variables distinguishing low-grade from high-grade tumors were variation in nuclear size, specifically the area, and the mitotic counts. Each of these factors was about 80% accurate in distinguishing between the two grades. From there, we developed more sophisticated algorithms that increased accuracy, such as random forest, decision trees, and logistic regression.

    We believe that we have redefined and simplified grading by focusing on measurable features. In fact, we were able to externally validate one of these algorithms, the random forest, in another cohort. By using these features, we can actually improve grading​ so that it does a much better job of separating patients whose cancers recur quickly from those that recur slowly or not at all​. This is part of our ​​unpublished work with Katherine Lindale, which shows that we can create prognostic scores by reprioritizing the features.

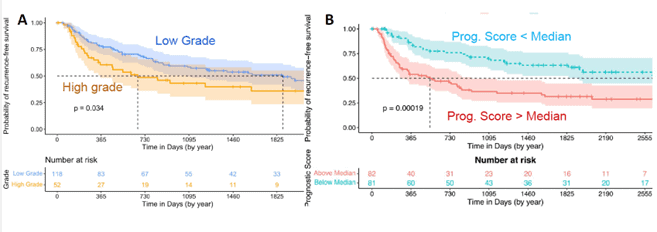
    Figure 3 – Improved grading study. Improving Bladder Cancer Grading with AI-Enabled Computer Vision Externally Validating Grading Models and Incorporating Highly Prognostic Nuclear Features

    We use these curves to show the time to recurrence—essentially, how long it takes for a second cancer to develop after the initial tumor is removed. In Figure 3A, you see the results using regular pathologist grading for the entire case. There’s a slight difference between low-grade and high-grade tumors, but the clouds overlap, meaning the distinction isn’t very dramatic. While the difference is statistically significant, it’s not very pronounced.

    In Figure 3B, you can see the results from our reprioritized grading algorithm using numerical cutoffs. This approach provides a much lower p-value and creates a greater separation between the curves. The bottom curve, representing low-grade tumors, recurs much faster than the top curve, which represents high-grade tumors that recur far more slowly.

    This improved grading technique could significantly guide treatment decisions. Patients with low prognostic scores could be treated with less frequent surveillance and cystoscopy, and might not need immunotherapy. In contrast, higher-risk patients would receive the intensive surveillance and treatment they require.

    That summarizes what we’ve done with Visiopharm and where we are now. Most of this work was done with small image samples, but we are now working together on an algorithm for whole-slide images, and progress is going well.

    Visiopharm: What challenges or limitations in your research led you to consider using AI solutions like the Visiopharm software?

    Prof. David Berman: Previous studies often relied on manual measurements of each nucleus, which would limit us to maybe a hundred nuclei per case instead of thousands. With manual methods, we might be able to measure a thousand nuclei, but very slowly, compared to the millions of nuclei we can measure using higher-throughput techniques. This increased throughput enables us to perform much more sophisticated analyses. Additionally, with the number of features involved, I don’t think we could have manually assessed and measured every single one of those features that I showed you in our study.

    Visiopharm: In what ways did Visiopharm prove to be the only viable solution for your research needs compared to other tools or methods you’re considering?

    Prof. David Berman: When we were choosing image analysis software, we found that Visiopharm offered a much richer dataset compared to other tools we were considering. It had many more features already built into it, and it was much easier to sequence different feature detectors one after the other in a pipeline.

    Pricing also played a role in our decision. Some other commercial vendors would charge for each type of analyzer or software, while Visiopharm provided us with access to the entire package, which was a significant advantage.

    Another key reason for choosing Visiopharm was their fantastic customer support. They truly felt like collaborators, and that level of partnership was incredibly important to us. It made the project go much more smoothly and continues to do so today.

    Finally, we wanted to work with a group that could help us eventually bring this classifier to a clinical desktop. We knew Visiopharm had the connections and capability to make that happen.

    Visiopharm: What are the next steps for moving from research to clinical application?

    Prof. David Berman: The major step we’re working on now is moving from small image samples, which are about a millimeter in diameter, to whole-slide images. Pathologists diagnose bladder cancer—and other cancers—from whole slides, not from small image samples. Transitioning to whole slides will give us more power to analyze heterogeneity in these features and explore whether there is a specific ​proportion of the cancer​​ that must be high-grade to drive a poor prognosis. This is something that other investigators have done qualitatively, but we see a huge opportunity to do it quantitatively using these tools.  Additionally, ​​validation with ​external​​ ​cohorts is always necessary, and we are collaborating with several partners to make that happen.

    Another important point is that much of AI use in pathology treats AI as a black box, where the image analysis program simply matches an image to a previous set of images and tries to emulate expert opinion. However, ​by focusing on “explainable” morphologic features that pathologists can see and verify themselves, ​we’re aiming for something more impactful. Our goal is not just to help pathologists who are struggling, but to elevate the work of all pathologists, even the best ones.

    In regular practice, there’s no opportunity to match grading practices directly with actual patient outcomes. To do so, you would need to go back years later, review what happened to a patient, and then revisit the grading. This would require having proper measurements in place, and our research offers a new opportunity to achieve this kind of work in a much more accelerated way using AI and sophisticated computational technology.

    Visiopharm: A lot of pathologists are still afraid of being replaced by AI, right?

    Prof. David Berman: Yes, and I’ve heard even very sophisticated pathologists express that concern. But I wonder—do we really want to trust a program to make decisions on its own, without human expertise? For example, it could recommend very invasive and life-altering treatments like surgery​ to remove a major organ​, chemotherapy, or immunotherapy, without any expert oversight. I don’t see that happening anytime soon.

    Curious to see the work of Professor Berman? Check out these recent publications.

    1. Slotman A, Xu M, Lindale K, Hardy C, Winkowski D, Baird R, Chen L, Lal P, van der Kwast T, Jackson CL, Gooding RJ, Berman DM. Quantitative Nuclear Grading: An Objective, Artificial Intelligence-Facilitated Foundation for Grading Noninvasive Papillary Urothelial Carcinoma. Lab Invest. 2023 Jul;103(7):100155. doi: 10.1016/j.labinv.2023.100155. Epub 2023 Apr 13. PMID: 37059267. 
    1. USCAP 2024: Improving Bladder Cancer Grading with AI-Enabled Computer Vision Externally Validating Grading Models and Incorporating Highly Prognostic Nuclear Features

  • Decoding the Liver Microenvironment: A Conversation with Prof. Heather Stevenson-Lerner

    Decoding the Liver Microenvironment: A Conversation with Prof. Heather Stevenson-Lerner

    Prof. Heather Stevenson-Lerner, MD, PhD

    The liver’s microenvironment holds the key to understanding and addressing complex liver diseases, from fibrosis to emerging infections. In this blog, we sit down with Professor Heather Stevenson-Lerner, MD, PhD, a physician-scientist and the sole liver pathologist at the University of Texas Medical Branch (UTMB), whose work spans over a decade of groundbreaking research in liver pathology and immune responses.

    Prof. Stevenson-Lerner shares her experience leveraging Visiopharm software to explore the liver microenvironment, offering unique insights into macrophage-mediated immune responses and the use of advanced AI tools for spatial biology analysis.

    She also highlights how Visiopharm empowers her team to study liver diseases with unprecedented precision, ensuring reproducible and impactful research outcomes.

    Read on for the full interview or watch the video recording to discover how Prof. Stevenson-Lerner is driving innovation in liver pathology.

    Visiopharm: Welcome, Prof. Heather, can you tell us a little bit about yourself?

    Prof. Heather Stevenson-Lerner: My name is Heather Stevenson-Lerner, I’m a professor in the Department of Pathology at the University of Texas Medical Branch (UTMB) in Galveston, Texas, and a physician-scientist studying the liver microenvironment and various types of chronic liver disease. I’ve been using Visiopharm software for nearly seven years, generating valuable data for our projects. I’m excited to share more about our work today.

    Visiopharm: Can you describe the primary focus of your research and the specific pathologies you’re studying with Visiopharm software?

    Prof. Heather Stevenson-Lerner: I’ve been the sole liver pathologist at UTMB since 2014, signing out every liver biopsy for over a decade. Visiopharm’s tools allow us to study the hepatic microenvironment using formalin-fixed, paraffin-embedded tissue. With access to a 30-year archive of liver tissue, we’ve analyzed a range of chronic liver diseases, such as steatotic liver disease, viral hepatitis C, autoimmune hepatitis, primary biliary cholangitis, and even infectious diseases like Ebola. At UTMB, we specialize in emerging infections, and the ability to analyze deactivated tissues without requiring high-containment labs has been invaluable.

    The primary focus of our research is to study the hepatic microenvironment. We’re very interested in macrophage-mediated immune responses, which play a critical role in promoting inflammation and fibrosis in the liver. We use archived liver biopsies to stain different antibodies, and Visiopharm is integral to our work, especially for multiplex staining. For instance, we use a six-antibody panel for macrophages, and we look at markers in the same compartment on the same cell, and there is no other software platform that allows us to analyse that.

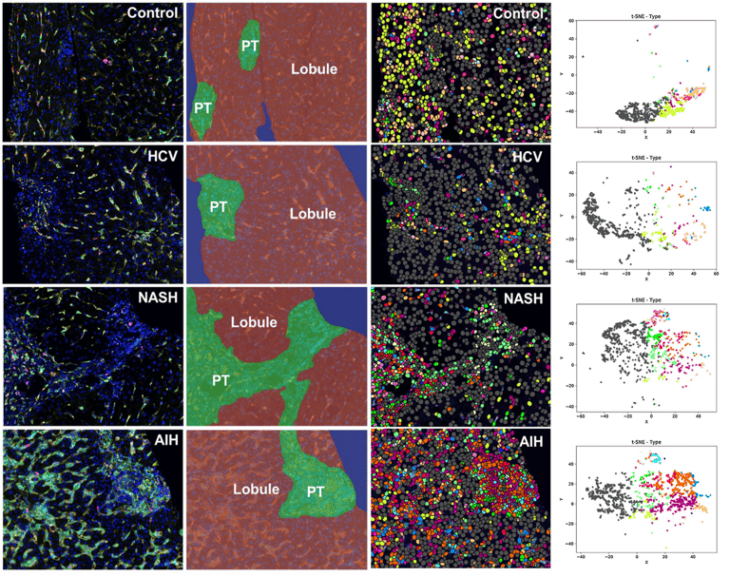
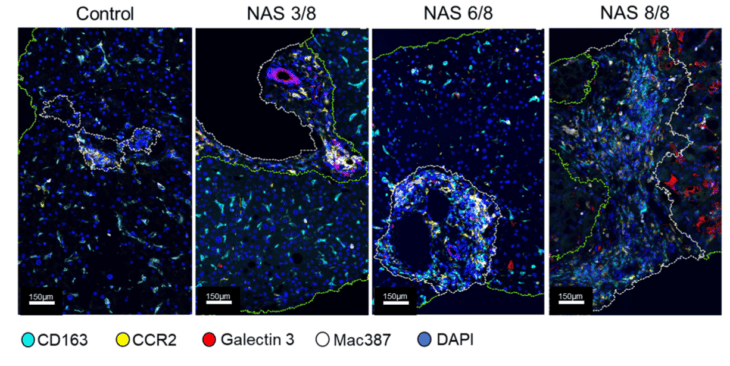
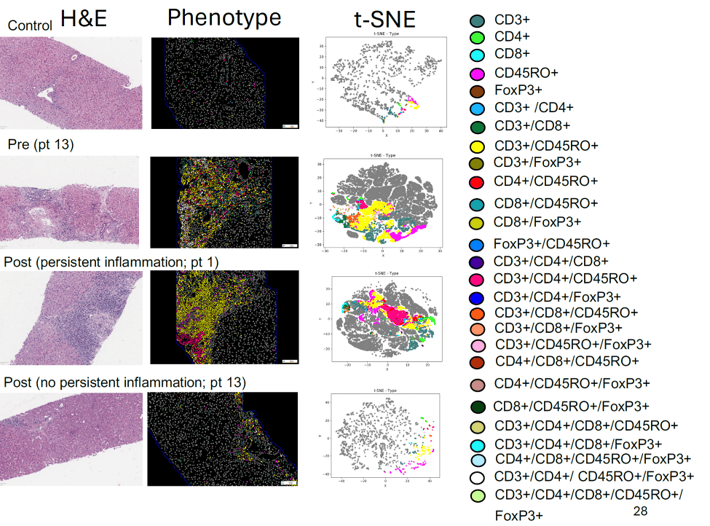
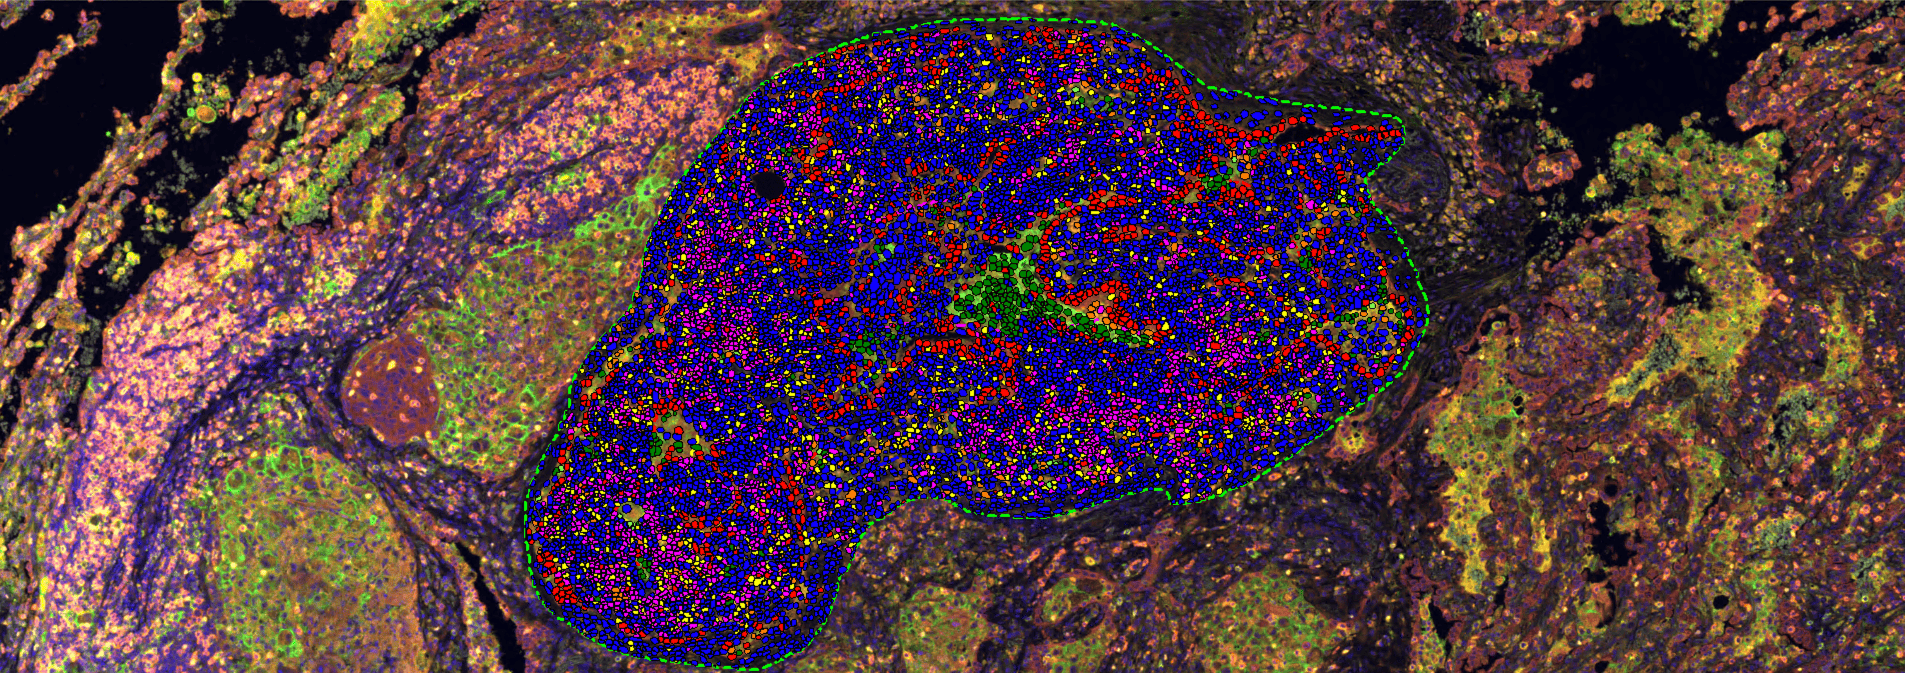
    DAPI, CD68 (Kupffer cells), CD14 (pro), CD16 (anti), CD163 (“M2”), Mac387 (Recruited).  Tissue segmentation, phenotyping, and data exploration with tSNE plots using Visiopharm software (Phenoplex).
    Visiopharm: What challenges or limitations in your research led you to consider using AI solutions like Visiopharm, for example?

    Prof. Heather Stevenson-Lerner: I collaborated with Dr. Jared Burks at MD Anderson Cancer Center when we started. Spatial approaches were already well-established for tumor microenvironments, so I thought, why not apply similar techniques to inflammatory liver diseases? We were among the first ones doing it here at UTMB, and now it’s really caught on. Obviously, the spatial field has grown so much in the last few years, but Dr. Jared Burks and I both came to the conclusion that Visiopharm was the best.

    In addition, when we first started using Visiopharm, we wanted to make sure that the data was reproducible. You know, patients are different. We have to make sure what we’re seeing is accurate. To validate our results, we collaborated with the bioinformatics group at the University of Michigan, which is one of the best in the country. We compared results from the same experiments using two different analysis methods: multicomponent TIFF files processed with Visiopharm and numerical cell segmentation data from InForm software (Vectra Polaris). And we did come up with the same. We have the same results by looking at the data in two completely different ways. The advantage of Visiopharm is that we can perform the analysis independently in our own lab without relying on external support.

    Visiopharm: How has the use of Visiopharm software improved the quality and accuracy of your research outcomes?

    Prof. Heather Stevenson-Lerner: We’re really trying to preserve the spatial aspects and keep the liver architecture intact. There are many great things out there. For example, when I was a graduate student, I did flow cytometry in the liver. But with flow cytometry, you have to homogenize the entire liver tissue. First, you need fresh tissue—not formalin-fixed—which can be challenging, especially with human patients. When you homogenize the liver, you separate the cells but can’t determine their spatial location. For example, is a cell in the portal tract or the lobule of the liver? What types of cells are next to each other? Who is interacting with whom? You can’t perform this kind of neighbor analysis with flow cytometry.

    Analysis of individual patients for variations in druggable targets (CCR2 and Galectin 3). Representative images with tissue segmentation into portal tract and lobular regions using Visiopharm software for image analysis (Phenoplex).

    Similarly, single-cell RNA sequencing recreates the liver microenvironment but still doesn’t preserve the architecture. Visiopharm allows you to analyze different cell types while maintaining spatial relationships. You can identify phenotypes, measure marker expression levels, and perform tSNE to study the relationships between cells. This ability to preserve liver architecture is something that the Visiopharm analysis enables that other applications cannot. Additionally, when looking for small signals, we also use NanoString to analyze whole RNA signatures from homogenized liver tissue. While NanoString is powerful, homogenization can dilute specific signals, such as those from a single cell type with a druggable target or marker expression. With Visiopharm, I can go directly into the liver tissue, segment CD68-positive macrophages, cluster them, and analyze their signals. This allows me to identify data I might miss when homogenizing the entire liver, making Visiopharm an incredibly powerful tool.

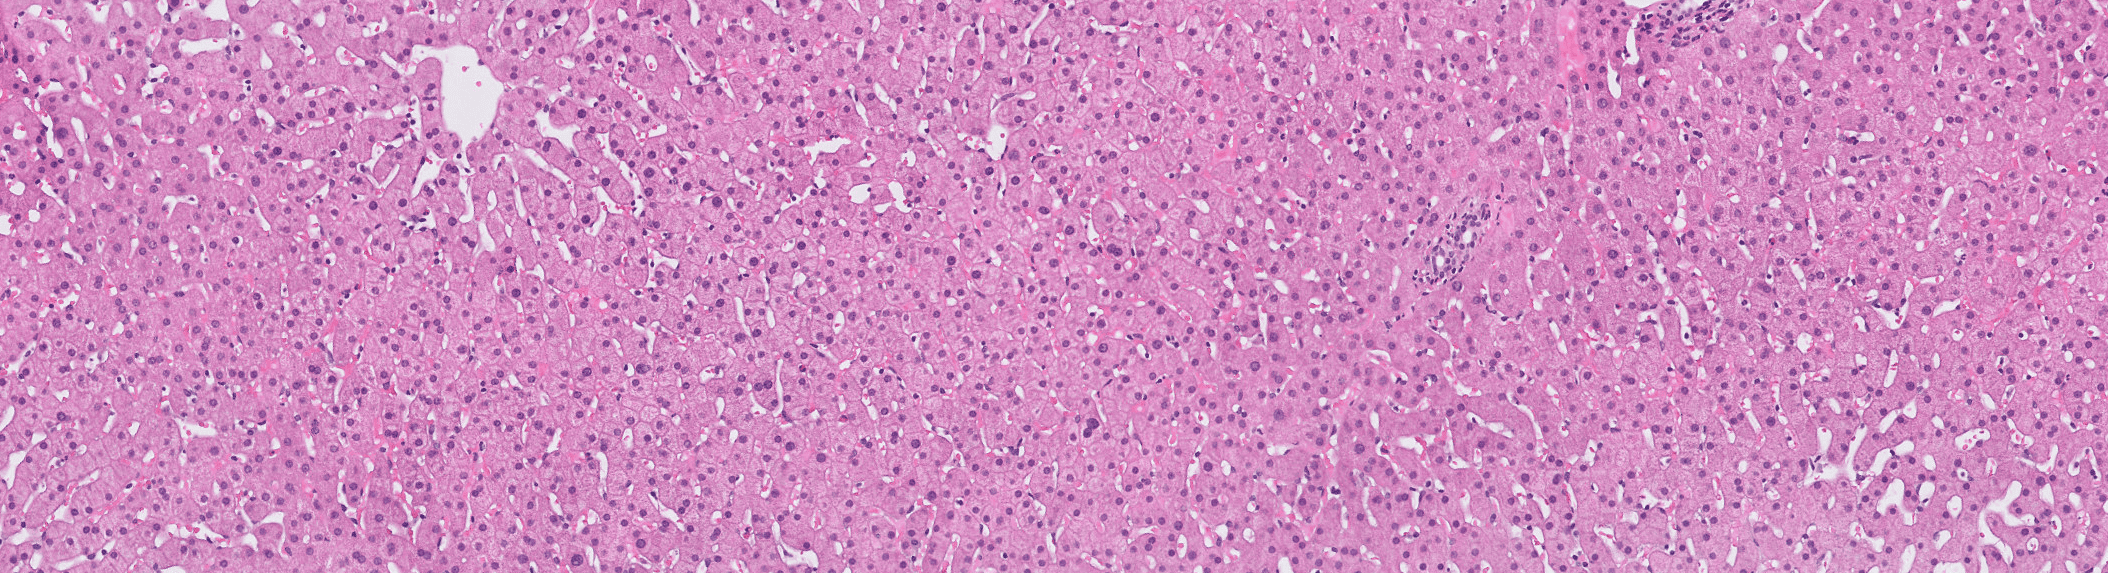
    Liver biopsies from patients with HCV analyzed with Visiopharm software (Phenoplex).
    Visiopharm: In which ways did Visiopharm software prove to be the only viable solution for your research needs compared to other tools or methods you considered?

    Prof. Heather Stevenson-Lerner: Well, I think there are several important things. As I mentioned, being able to stain multiple antibodies in the same cellular compartment is crucial. We try to combine different types of antibodies—some that are nuclear, cytoplasmic, or membranous—which helps. However, we also work with antibodies like CD68, CD163, CD14, and CD16, which are all in the same compartment but labeled with different fluorophores or Opal fluorophores. Visiopharm has been the best at accurately separating these cells with antibodies in the same compartment.

    Another key advantage is the ability to use pre-existing algorithms from Visiopharm’s website. Once we develop customized algorithms, we can apply them to different chronic liver diseases with minimal adjustments. For example, we created an algorithm for chronic hepatitis C (HCV) and, with slight modifications, applied it to patients with autoimmune hepatitis. This flexibility is especially helpful when using the same macrophage antibody panel across various diseases.

    Additionally, the training sessions with Visiopharm have been invaluable. These sessions are included in our software package, and we’ve had weekly meetings during heavy usage periods or when addressing software updates or specific questions. This ongoing training has been crucial to our success.

    Are you curious to see the work of Prof. Heather Stevenson-Lerner? Check out these recent publications:

    Saldarriaga OA, Wanninger TG, Arroyave E, Gosnell J, Krishnan S, Oneka M, Bao D, Millian DE, Kueht ML, Moghe A, Jiao J, Sanchez JI, Spratt H, Beretta L, Rao A, Burks JK, Stevenson HL. Heterogeneity in intrahepatic macrophage populations and druggable target expression in patients with steatotic liver disease-related fibrosis. JHEP Rep. 2023 Nov 3;6(1):100958. doi: 10.1016/j.jhepr.2023.100958. PMID: 38162144; PMCID: PMC10757256.

    Wanninger TG, Saldarriaga OA, Arroyave E, Millian DE, Comer JE, Paessler S and Stevenson HL (2024) Hepatic and pulmonary macrophage activity in a mucosal challenge model of Ebola virus disease. Front. Immunol. 15:1439971. doi: 10.3389/fimmu.2024.1439971

    Explore her research in depth in this insightful lecture:

  • Glint Lab’s Journey with Visiopharm Software

    Glint Lab’s Journey with Visiopharm Software

    Welcome to our latest blog interview, where we spotlight Glint Lab, a full service histopathology and digital pathology lab located in San Diego, California. Today, we’re joined by three of their leading experts—Chief Scientific Officer Oanh Nguyen, Director of Image Analysis Jason Roberts, and Chief Executive Officer Misagh Naderi, to explore how they’re leveraging Visiopharm’s advanced image analysis software to address some of the most complex scientific questions.

    In this insightful conversation, they share their experience implementing Visiopharm software, highlight key features that are driving their research forward, and showcase innovative ways they are using digital pathology to unlock new insights in the field.

    https://visiopharm.com.upd.mtra.in/wp-content/uploads/Oanh-Nguyen-Headshot.png

    Oanh Nguyen
    Chief Scientific Officer at Glint Lab
    I am a scientist with a strong background in histopathology and assay development/optimization for advanced tissue-based assays, including IHC or mIHC, immunofluorescence or mIF, and in situ hybridization, along with other advanced protein-RNA multiplex assays. My expertise lies in enhancing these assays to obtain actionable quantitative data and insights for scientific research. With experience working in both clinical diagnostic lab environments and the preclinical and discovery research space, I bring an understanding of both clinical and research-based applications and the needs of our clients, helping to design and develop assays from the earliest stages for potential clinical applications.

    Jason Roberts - Director of Image Analysis at Glint Lab

    Jason Roberts
    Director of Image Analysis at Glint Lab

    I am a data scientist dedicated to advancing computational pathology and spatial biology through innovative machine learning solutions. Drawing on my deep experience in image analysis, I engineer computer vision algorithms and leverage statistical models to transform biological data into meaningful insights. Through my work, I strive to bridge the gap between data science techniques and biological research, ultimately contributing to more effective diagnostic tools and therapeutic strategies.

    Misagh Naderi - Chief Executive Officer at Glint Lab

    Misagh Naderi
    Chief Executive Officer at Glint Lab
    I began my career as an engineer before transitioning into biology, building a portfolio of research publications in molecular virology and computational biology. My experience extends to technology commercialization and IP law, particularly in life science technologies that integrate AI and machine learning. For the past three years, I’ve had the privilege of working on projects that blend technology, histology, and biology in innovative ways. As CEO of Glint Lab, I’m fortunate to collaborate with a team of experts focused on leveraging technology across the workflow and in image analysis to enhance quality and produce quantitative, actionable insights for research and clinical trials. My goal is to keep learning and contributing to advancements that lead to better treatments and improved patient outcomes.

    Can you tell us a bit about Glint Lab and which services you are offering to your customers?

    Misagh Naderi: Glint Lab is a full service histopathology and digital pathology laboratory based in San Diego, California. We are a team of seasoned lab and data scientists dedicated to revolutionizing preclinical and early drug discovery through our comprehensive suite of precision pathology services.

    We pride ourselves on delivering high quality tissue processing, sectioning, histology, and cutting-edge image analysis services.

    Unlike traditional labs, we view our relationship with clients as a partnership. We go beyond transactional services to foster meaningful collaborations that drive scientific discovery. For example, our clients can consult with us prior to project initiation in order to prepare the study design and the budget that relates to their histology and data analysis needs. Our clients’ success is our success, and we are committed to delivering the best data possible to fuel their research endeavors.

    Since when have you been using Visiopharm and what led you to Visiopharm originally?

    Jason Roberts: Visiopharm was among the first systems we integrated at the launch of Glint Lab earlier this year, but our team has extensive experience with the software. Visiopharm offers us the unparalleled ability to develop robust custom algorithms for a wide variety of image analysis applications, and to explore spatial data in ways that can not be done with comparable tools. In the rapidly evolving field of digital pathology, integrating Visiopharm’s AI-driven image analysis software is transforming our approach to understanding complex biological systems.

    Which features of Visiopharm do you consider most impactful thus far?

    Jason Roberts: We greatly value the platform’s cutting edge deep learning classifiers and neural network architectures which we employ for a multitude of image processing tasks. The professional and enhanced modules enable us to perform image preprocessing, automated array handling, image coregistration, and neural network parameter optimization for our most complex and challenging studies. The interactive data exploration tool is one of our favorite features and certainly sets Visiopharm apart. It empowers us to generate captivating, feature-rich visualizations to examine cellular relationships in context. This approach results in the deepest possible insights for our client’s tissue data – effectively driving informed decisions and propelling their research forward.

    Phenoplex in action: Glint Lab harnesses advanced data exploration tools for precise navigation and insights.

    We also believe that cooperation and long term partnerships are fundamentally important to being successful in the dynamic biotechnology research industry. Visiopharm’s collaborative ethos and commitment to innovation in digital and computational pathology made choosing their tools a clear and easy decision. We appreciate the opportunity to work with the Visiopharm team, and look forward to testing out new features, providing feedback, and playing an active role in the continued development of their image analysis software.

    Can you describe the process of implementing Visiopharm and how your experience has been working with our team?

    Jason Roberts: Our experience with the Visiopharm team has been exceptional. We are very grateful to work with such an experienced, professional, and knowledgeable group of people. The folks we’ve worked with across professional services, sales, marketing, leadership, and engineering have been instrumental in implementing our image analysis services.

    Jeni Caldara, Strategic Partnerships Manager, has been a considerable asset to our organization and has offered a plethora of strategies to both maximize and streamline our use of the software to best serve our clients needs. Brenna O’Neill, Application Support Specialist, has provided us with incredibly valuable training and onboarding sessions, and is always quick to respond with creative and effective solutions to our technical questions. Raymond Brandenburg, IT Solutions Architect, has supported us in the configuration of our powerful cloud computing environments, and advised our team on inventive IT integration practices. We look forward to expanding our relationship with the Visiopharm team as our organization continues to grow.

    Which kinds of problems or questions of your customers can you address with Visiopharm?
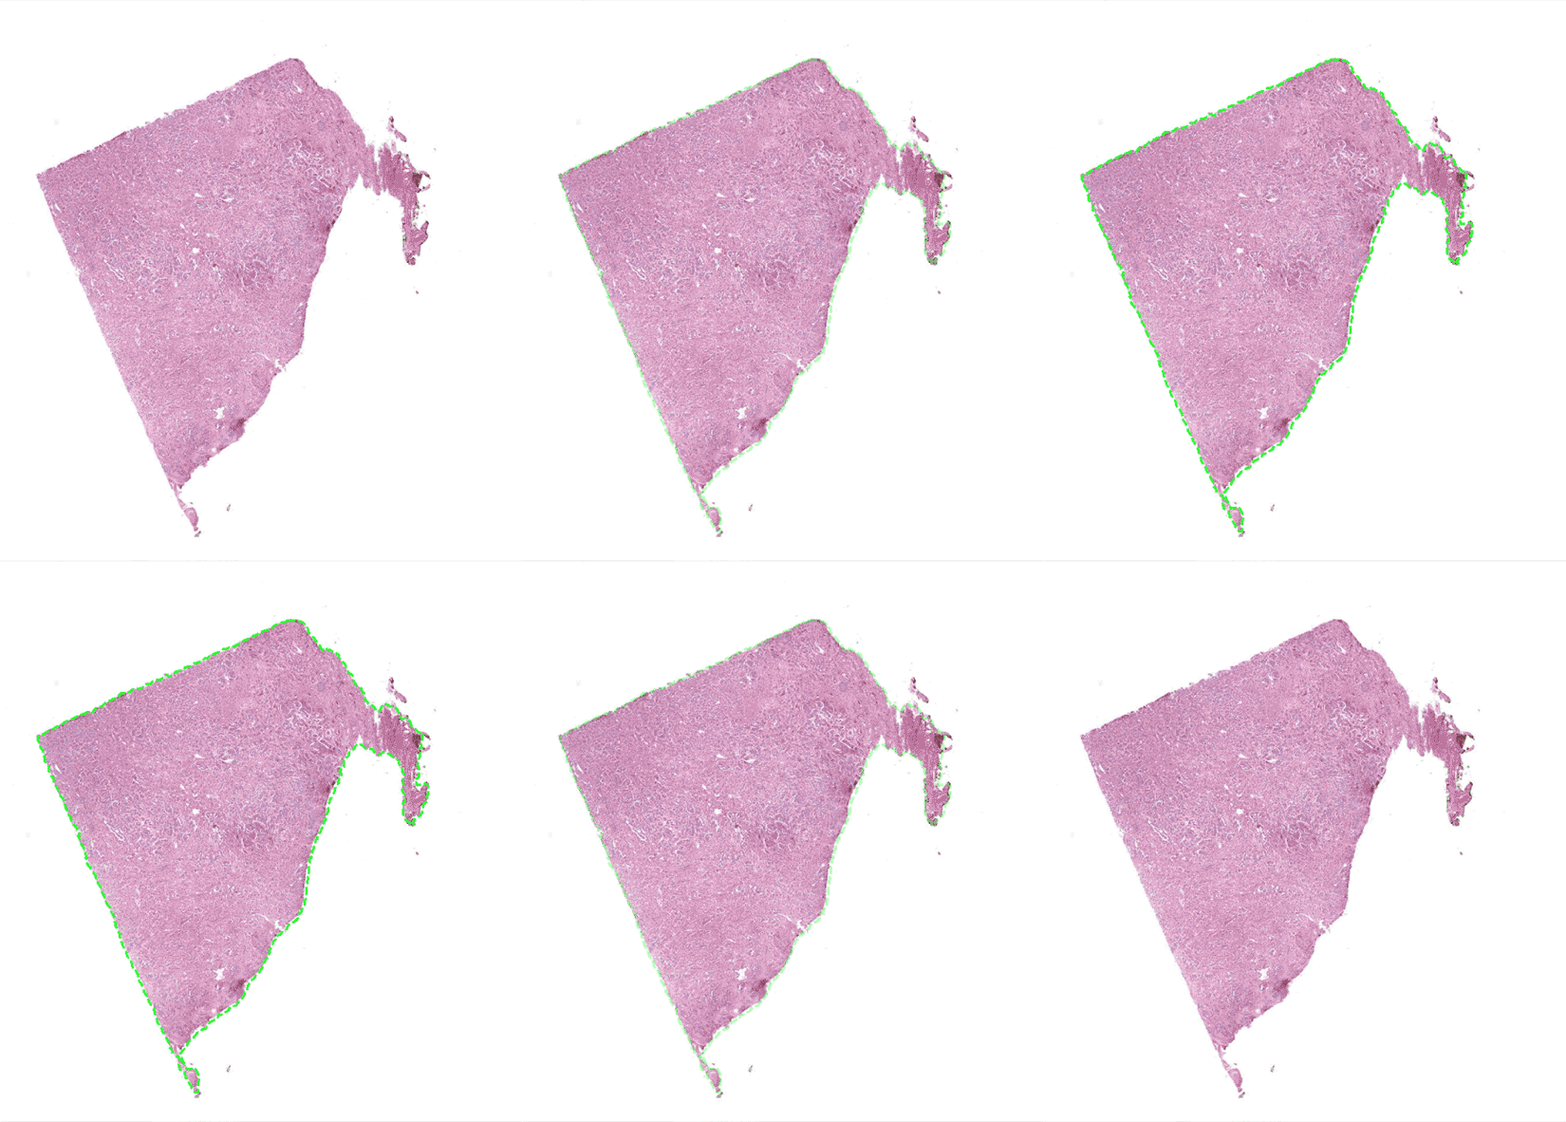
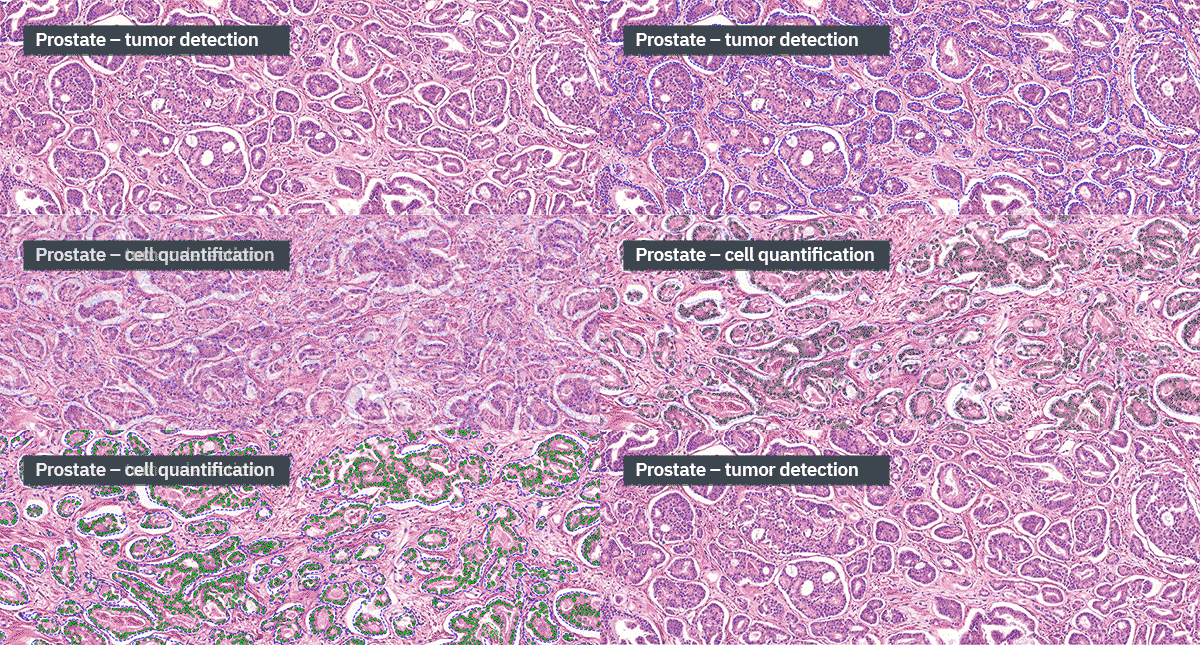
    Prostate – Tissue detection

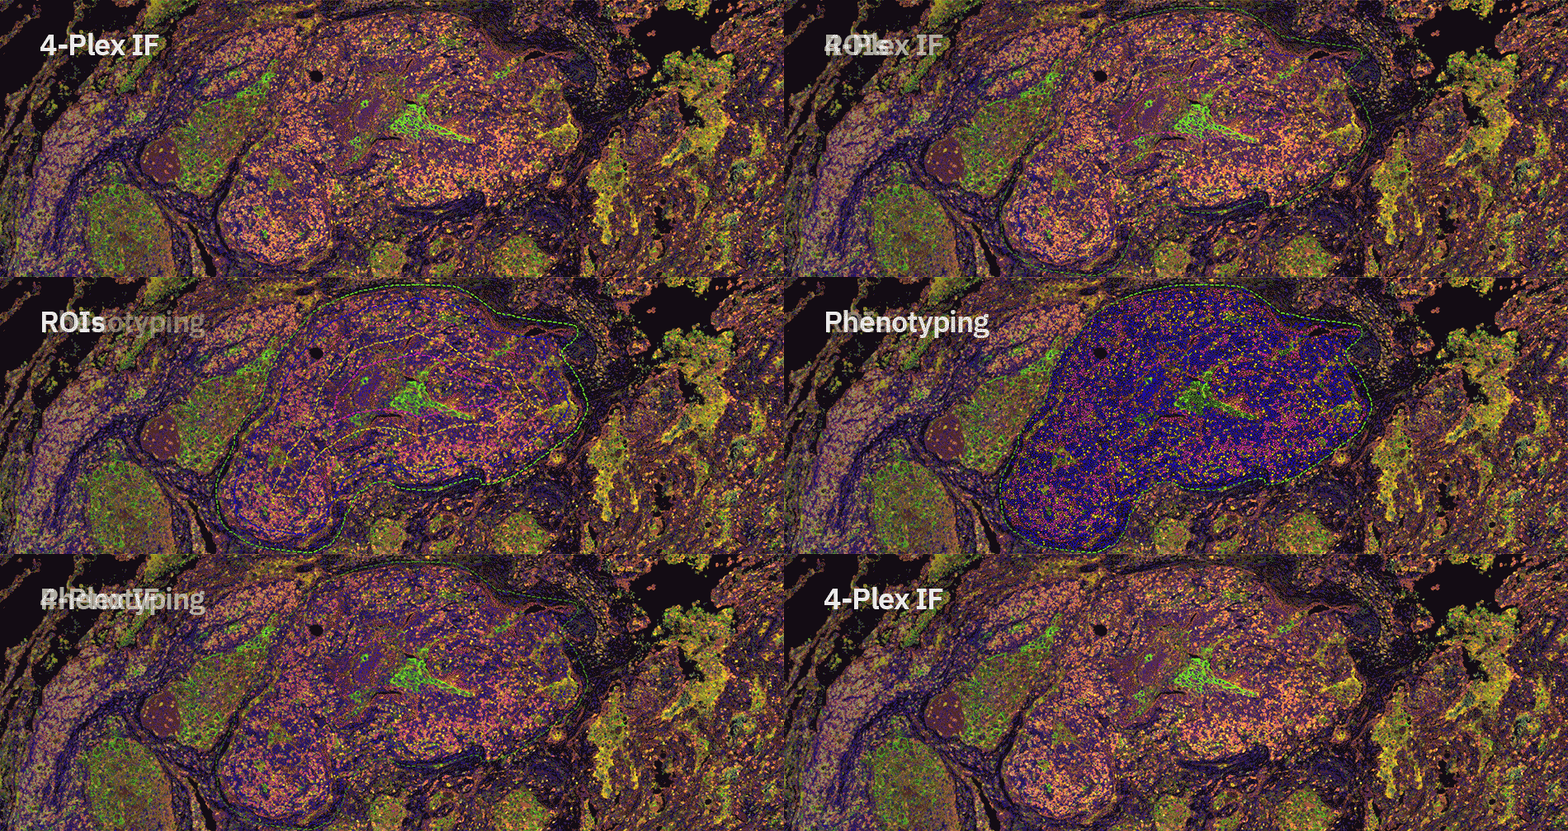
    Oanh Nguyen: At Glint Lab, we use Visiopharm’s advanced image analysis software to tackle a wide range of challenges faced by our clients. From IHC/IF or mIHC/mIF to special stains to RNA ISH, we provide standard image analysis quantitative outputs and custom solutions. With Visiopharm, we excel in spatially resolved quantification, enabling us to perform complex analyses such as clustering, neighborhood mapping, proximity assessments, and evaluations of aggregation, infiltration, density, and dispersion. Our expertise spans multiple disease areas, including Toxicology (e.g., toxicity in rodent tissues), Oncology (e.g., tumor microenvironment analysis in human samples), Immunology (e.g., immune cell profiling in human, rodent and other tissues), Musculoskeletal disorders (e.g., Laminin/Dystrophin analysis in Duchenne Muscular Dystrophy (DMD) models, centralized nuclei analysis in muscular dystrophy X-linked mouse (mdx) models), Cardiometabolic diseases (e.g., adipose tissue analysis in pig models), Nephrology (e.g., glomerular assessments in human and rodent kidney tissues), NASH (e.g., fibrosis evaluation in rodent liver models), and more. We also have extensive expertise across various species and tissue types, including Rodents, NHP (Non-Human Primates), Pigs, Rabbits, Humans, Organoids, and others, ensuring that your data is examined with the most relevant biological context. Visiopharm’s APP center algorithms further enhance our capabilities, allowing for custom analysis and visualization that meet the specific needs of your project. Through this partnership, Glint Lab and Visiopharm empower you to gain deeper insights from your tissue samples, providing the robust, accurate, and actionable data needed to advance your research.

    Can you share some of the creative ways you use our software?

    Jason Roberts: We deployed VIS in a powerful cloud environment which optimizes compute and storage while maintaining maximum usability for both our data scientists performing image analysis and our clients. Taking advantage of our unique cloud architecture, we’ve developed an advanced data analytics platform to be used by our clients and collaborators. Here’s how it works: we share a secure and easy-to-access VIS viewer with researchers who want to review their results and carry out granular downstream analysis using Visiopharm’s data exploration tools. Our advanced analytics platform powered by Visiopharm allows our clients, whether they are scientists, pathologists, or bioinformaticians, to efficiently review and investigate their data, elucidate spatial cellular relationships, and generate publication-ready visualizations.

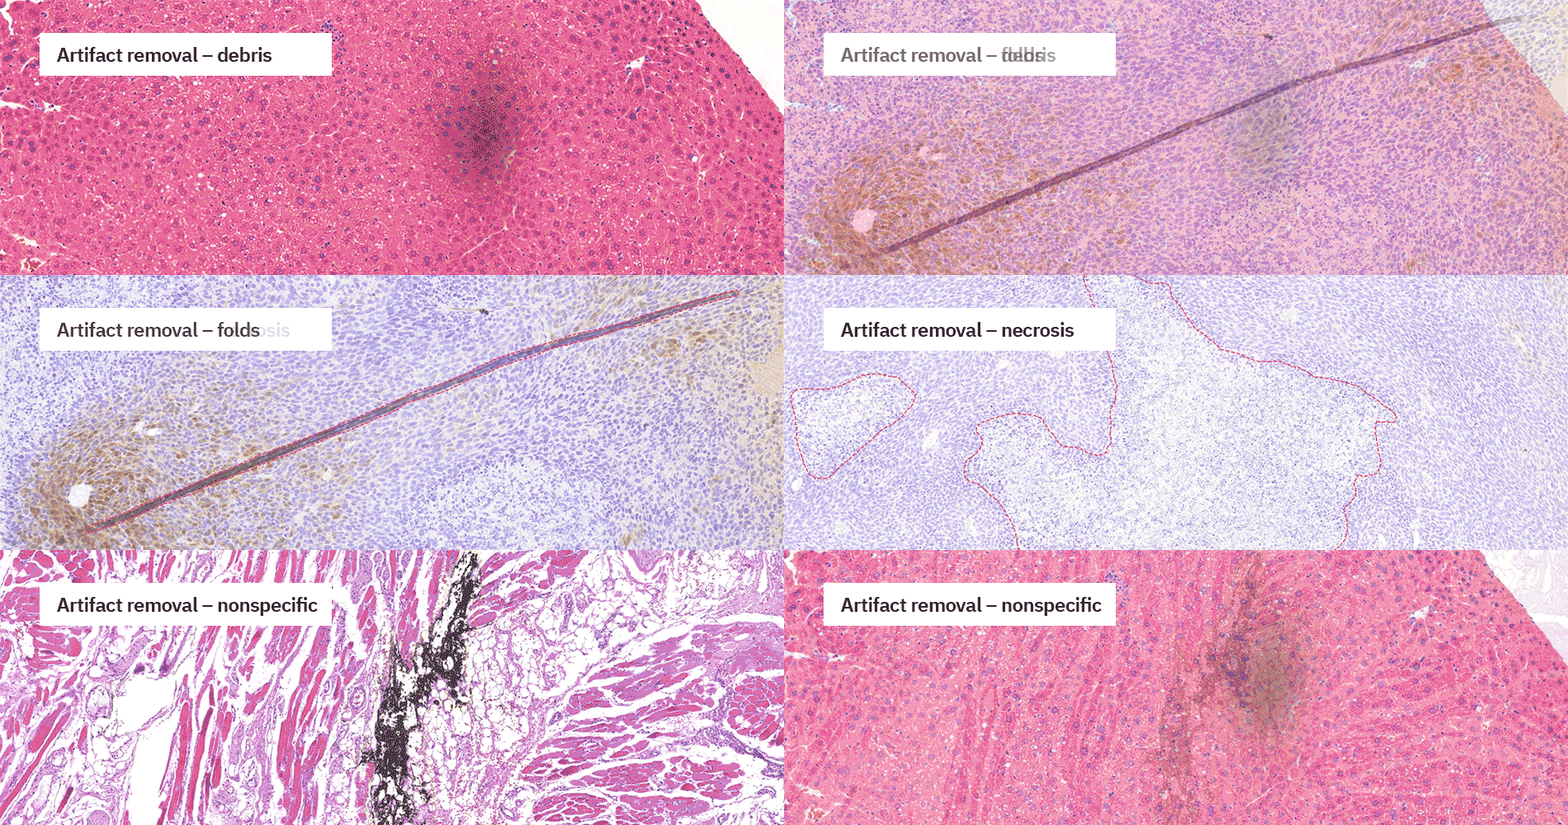
    We also leverage Visiopharm to engineer robust quality control and staining consistency assessment algorithms. Our team has developed APPs that automatically identify and exclude pre-analytical artifacts including: folds, blur, slide debris, out of focus areas, nonspecific staining, blood, and more. In addition, we’ve built tools to assess staining quality and consistency of H&E, IHC, and IF images through detailed evaluation of staining intensities across images or batches in a given project. These APPs are always deployed at the beginning of a study, and they are essential in maintaining our rigorous quality standards at Glint Lab.

    Robust quality control and staining consistency tools with Visiopharm software.

    We benefit from Visiopharm’s bidirectional integrations with other digital pathology software as well, including our image management system. We engage the integration to easily import newly-scanned samples into VIS with only a few clicks, as well as pathologist’s annotations for use as analysis ROIs or as input data for training new models.

    Can you describe the advantages of using your data analysis platform powered by Visiopharm?

    Misagh Naderi: After analyzing the images and providing quantitative results, we share an easily accessible instance of Visiopharm with our clients. Here, they can further explore cutting edge algorithms such as clustering methods to dig deeper into the quantitative data that our expert image analysis team has extracted for them. We believe that providing high quality data together with Visiopharm’s tools to transform the data will allow our clients, who are experts in their respective fields, to come up with the best informed hypotheses for future studies. Again, our clients’ success is our success, and we extend all of our resources to make sure they get the most value out of their projects with us.

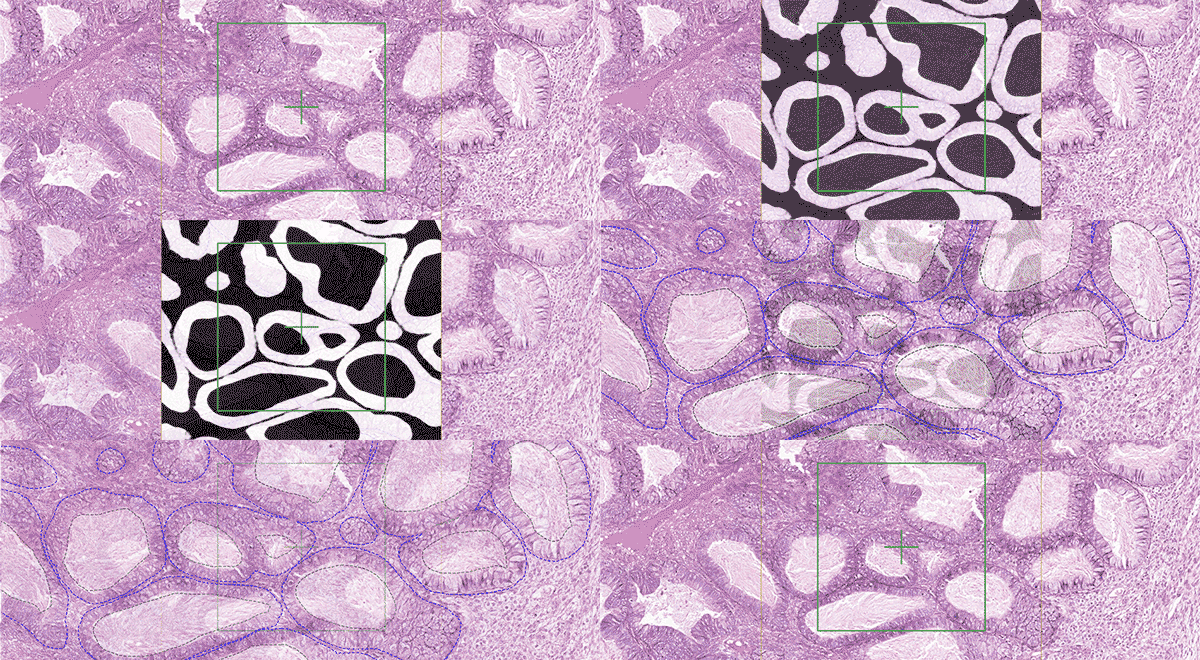
    Ovarian tissue analysis and neural network probability feature map
    Can you give examples of exciting future applications for Visiopharm at Glint Lab?

    Jason Roberts: We look forward to implementing Visiopharm to analyze more multiplex IHC and multiplex IF assays in order to dissect and examine intricate cellular interactions, phenotypes, and biomarker distributions. We also look forward to using Visiopharm’s comprehensive tools to interpret spatial transcriptomics data, allowing us to map gene expression patterns within their native tissue architecture and advance our knowledge in spatial biology. Next-generation neighborhood analysis tools further enable us to investigate microenvironmental interactions at a cellular level, revealing how cellular neighborhoods influence disease progression. Visiopharm’s image analysis solutions are transforming digital pathology, offering profound improvements in patient care, and paving the way for an exciting and optimistic future of personalized medicine. At Glint Lab, we are honored to be a part of this journey.

    Wherever your research takes you, we will be there 

    Glint Lab’s success story is a testament to the power of integrating cutting-edge technology with scientific expertise to tackle challenging research questions. By combining Visiopharm’s powerful image analysis tools with their deep understanding of pathology and data science, they’re pushing the boundaries of what’s possible in preclinical and drug discovery research. 

    If you have any questions or would like to learn more about their work, feel free to reach out to the Glint Lab team directly at scientist@glintlab.com 

    To explore how Visiopharm can support your own research, contact us to learn more about our solutions and services. 

  • Straticyte™ – A digitally delivered oral cancer predictor – powered by Visiopharm analysis 

    Straticyte™ – A digitally delivered oral cancer predictor – powered by Visiopharm analysis 

    Kenneth P.H. Pritzker, M.D., BSc (Med), FRCPC

    Kenneth P.H. Pritzker
    M.D., BSc (Med), FRCPC

    Dr. Ken Pritzker served as Chief, Pathology and Laboratory Medicine, Mount Sinai Hospital, Toronto from 1986 to 2008 and as a founder of Mount Sinai Services, a laboratory service outreach vehicle for the biomedical research and innovation sector.

    With over 290 scientific publications and 27 book chapters, Ken is a recognized leader internationally in the fields of arthritis, biomaterials, genomics, cancer diagnostics and nanotechnology. Throughout his career, Ken has served in leadership and advisory positions to national and international professional societies, research institutes and healthcare organizations.

    Ken Pritzker co-founded the company Proteocyte AI in 2011. The company just brought to market their first prognostic LDT test for oral pre-cancer lesions, Straticyte.

    Visiopharm: Can you tell us more about your company Proteocyte and how it all began?

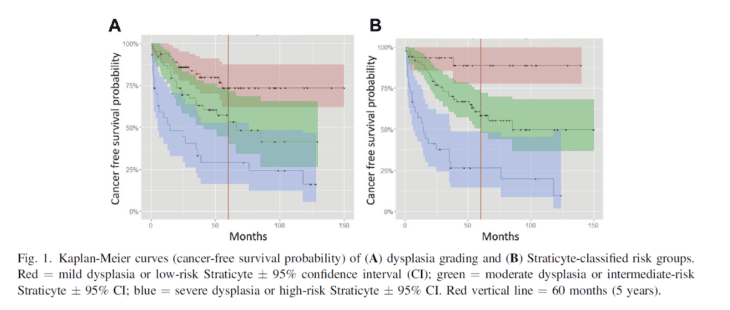
    Dr. Ken Pritzker: Sure, it all started several years ago, when Dr. Ranju Ralhan and Michael Siu discovered, that the nuclear accumulation of S100A7 could serve as a predictor of poorer prognosis for Head and Neck squamous cell carcinoma and could predict a higher risk of transformation of oral premalignant lesions.1 We founded Proteocyte to dive deeper into this promising prognostic biomarker. Even though this finding could be applied to different cancer types, oral cancer was of particular interest to us, due to its high mortality of 50%, which is largely related to late diagnosis. Those late-stage lesions are very costly and difficult to treat. A high percentage of these cancers develop over multiple years in patients who have atypia initially, so they get a biopsy, but it often does not reveal pathologic dysplasia in the histopathologic examinations. Also, the histopathological dysplasia grading, which shows high inter- and intraobserver variation, does not relate very well to the risk of developing cancer from the lesion.2,3 However, some of those samples with mild dysplasia do show the S100A7 accumulation and thus have an elevated Straticyte value. So this is a very important finding because it alerts the clinicians to follow the patient fairly closely, despite their low histopathological grading.

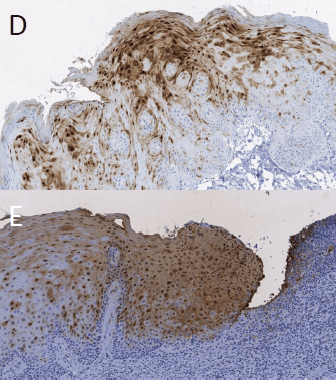
    Immunohistochemistry staining of S100A7 biomarker

    Figure 1 Immunohistochemistry staining of S100A7 biomarker in D) STRATICYTE Medium Risk E) STRATICYTE High Risk; From: BM Renick and MR Darling, Clinical Management of Patients With Oral Epithelial Dysplasia And Elevated STRATICYTETM Risk For Progression To Cancer, Poster @ IAOO, 2019

    Visiopharm: What led you to choose Visiopharm and how has it been working with the company?

    Dr. Ken Pritzker: We already knew the company and had worked with the software for several years back then at the Mount Sinai Hospital in Toronto. Already at this time, Visiopharm was one of the market leaders of morphometry applied to digital images of tissue slides. We already had a good and long relationship with them and the team, who provided advice. Back then it was just a few people, and we had a great relationship. They have been excellent, and the quality of support has been really superb, so we’ve been very happy with it. Visiopharm software is used to quantitate the immunohistochemical marker and it’s also used to measure certain morphological aspects of the cells. With the support of the Visiopharm team, we have created several APPs in Visiopharm, covering the whole workflow from region detection to score calculation.

    Visiopharm: So how does Straticyte work and how can physicians use it?

    Dr. Ken Pritzker: Our product Straticyte is an LDT test and it combines the evaluation of this specific IHC cell marker with an evaluation of cell morphometry. There are very few, if any, other biomarkers products out there which have a combination of two very different modalities. So this was an innovation. The other is that we saw ourselves from the beginning as an information company. The idea would be that the image of the oral epithelium would be transmitted to the company for analysis, and that we would have a serial database from which we could continue to develop the product and that has been a successful approach. Straticyte can calculate the 5-year probability that dysplastic lesions will progress to cancer. It has a sensitivity of 96% and a NPV of 95%, and those are significantly higher than the values for histological dysplasia grading, which are 75% and 59% respectively.4 The test is so good that if the Straticyte value is low, the patient can go back to live a normal life. But for cases with an elevated Straticyte value, those patients need to be watched closely and followed up against a possible recurrence or cancer. So compared to the current practice, Straticyte provides greater objectivity, sensitivity, and predictive power.

    The way it works is that the physicians anywhere take a biopsy and that is assessed by the pathologist for whether there is pre-cancer present. If so, the pathology lab forwards unstained slides to one of our reference laboratories, which are contracted with Proteocyte and this lab performs the stains. The scanned image is then sent to us and we analyze the image and issue a report.

    Figure 2: From: Hwang JTK et al, 2017, doi: 10.1016/j.oooo.2016.11.004

    Visiopharm: How did you develop and validate your product?

    Dr. Ken Pritzker: We started with samples from 250 patients with oral pre-cancer. From there we expanded to other sites in Canada, a site in Ireland and several sites now in the United States. By now, we have a database of more than 600 patients with clinical follow up. That’s probably the largest database of oral pre-cancer that exists, because typically, these patients present to local hospitals and if they have pre-cancer, they may not be followed up very well. So we know exactly the relationship between the test and the prognosis out beyond five years. It’s now more than ten sites and very different populations. And we noticed that lesions from different places have different characteristics. Those might reflect the state of health care in different places or the state of nutrition and this cannot be picked up if you do a single-site database.  

    At this point, the algorithm is very mature and our laboratory has received ISO15189 and CLIA accreditation. In the background we work on improving the tests, but it requires a considerable validation operation to move it from the version which we’re using, which is quite good to the next version, which might be a bit better.

    Learn more about Straticyte.

    ——————————————————————————————————————–

    Main references related to the interview
    1. Tripathi et al, 2010, DOI: 10.1371/journal.pone.0011939 ↩︎
    2. Dost F, Le Cao K, Ford PJ, Ades C, Farah CS. Malignant transformation of oral epithelial dysplasia: a real-world evaluation of histopathologic grading. Oral Surg Oral Med Oral Pathol Oral Radiol. 2014;117:343-352. ↩︎
    3. Fleskens S, Slootweg P. Grading systems in head and neck dysplasia: their prognostic value, weaknesses and utility. Head Neck Oncol. 2009;1:11. ↩︎
    4. Hwang et al, 2017, DOI: 10.1016/j.oooo.2016.11.004 ↩︎
  • A Guide to Cell Segmentation in Multiplex Tissue Imaging with AI

    A Guide to Cell Segmentation in Multiplex Tissue Imaging with AI

    This blog post is inspired by the scientific poster presented at the Pathology Visions conference in 2021 by Daniel E. Winkowski, Ph.D., Jenifer Caldara, Brit Boehmer, Ph.D., and T. Regan Baird, Ph.D.

    Today, let’s explore three different approaches to segmenting cells in samples stained with various multiplexed fluorescent assays.

    Starting with the challenge: Precision in Complexity

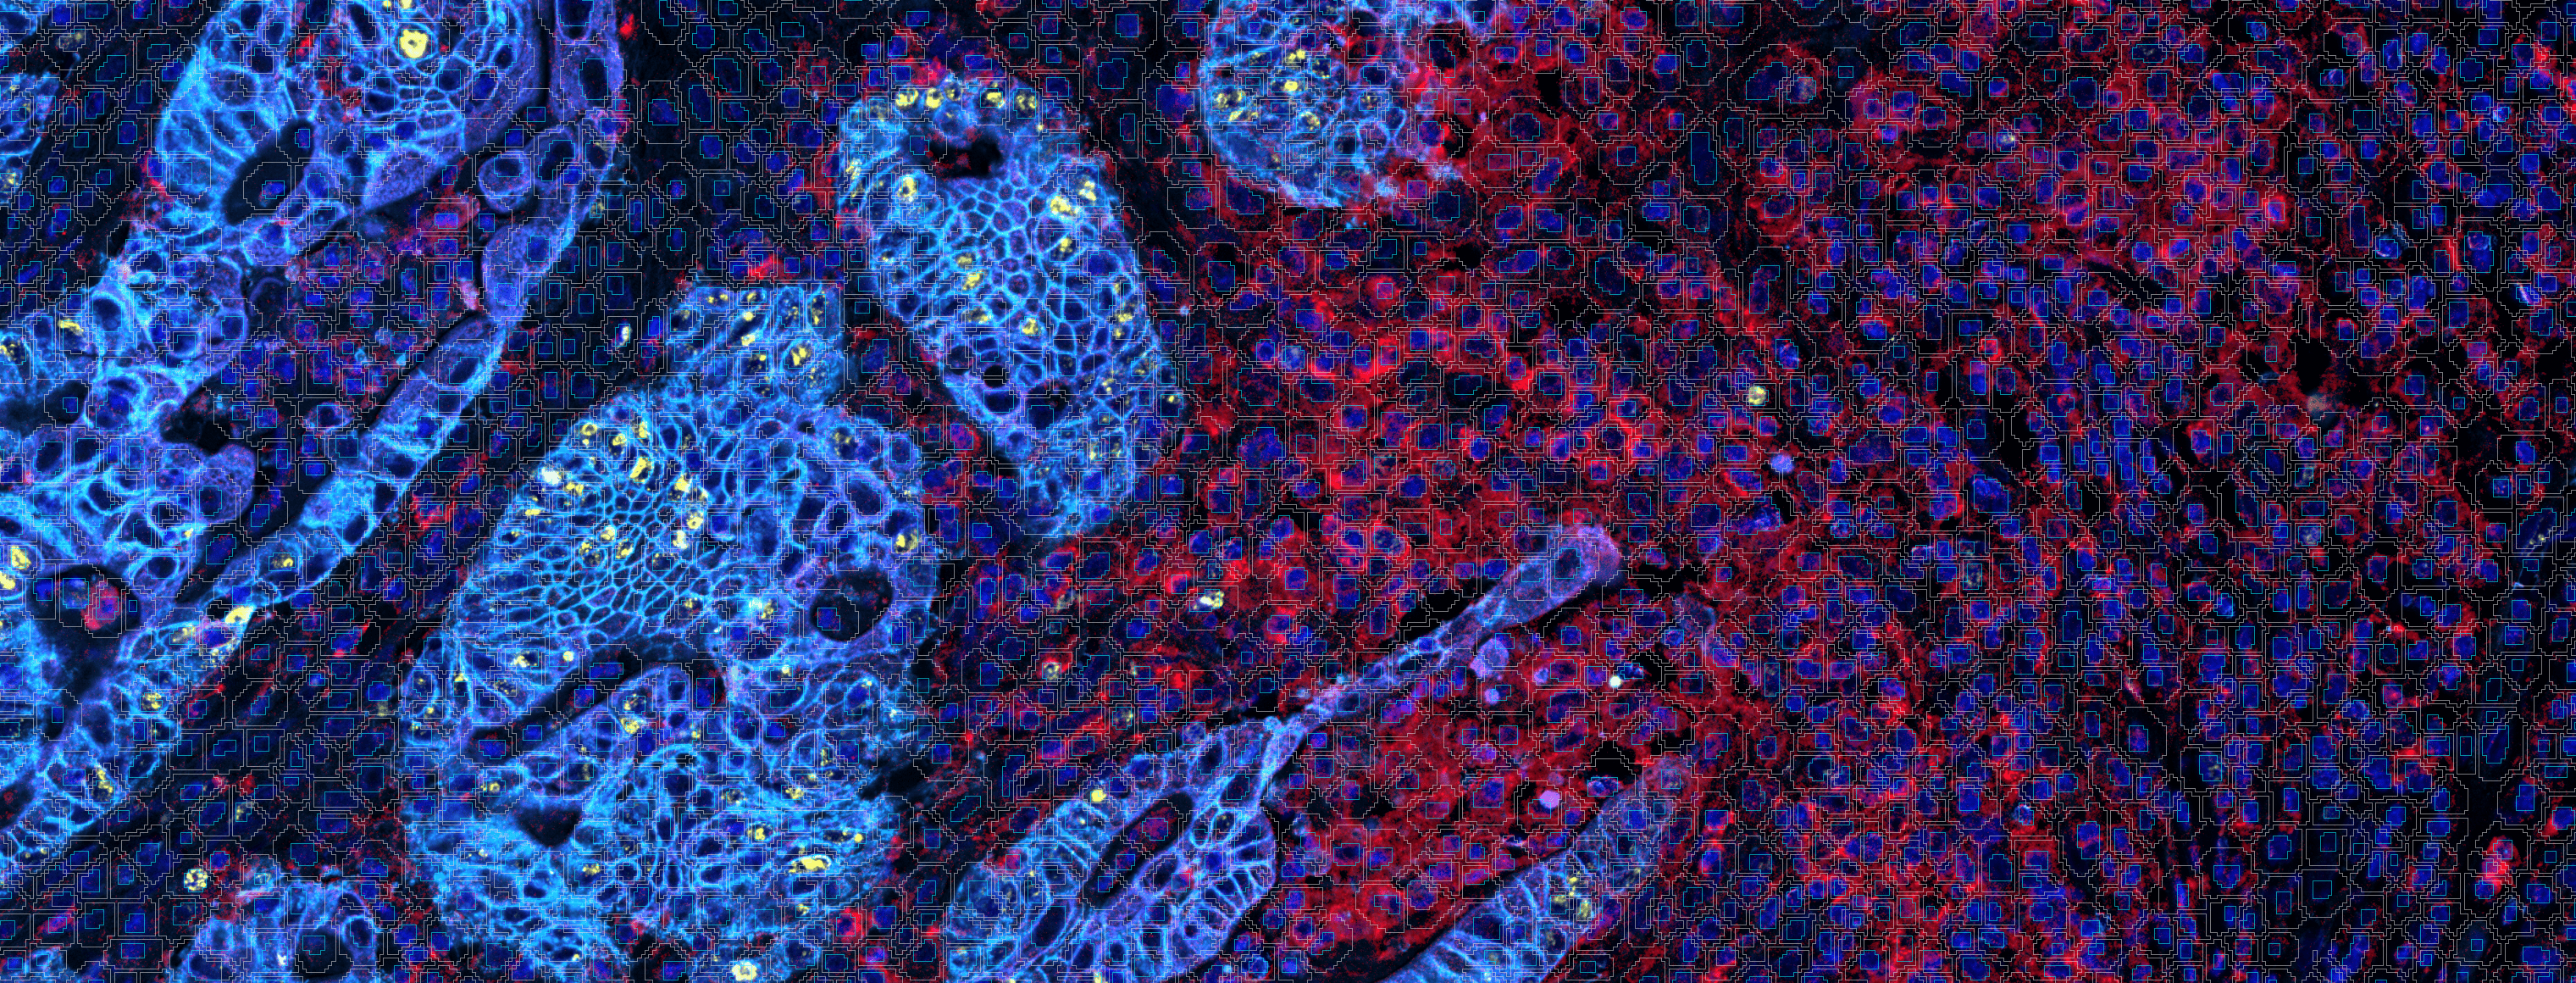
    In tissue pathology, multiplex tissue images have become crucial, allowing us to observe each cell’s location and understand its complex features. Yet accurately and automatically defining each cell’s outer boundary for analysis proves challenging. The reason for that is that tissues contain a heterogeneous mix of cells, each of their own shape and size. Commonly used methods for cell segmentation only focus on nuclei, but those often fall short in precisely defining cell edges.

    Let’s compare the methods: Traditional vs. A.I.-Powered 

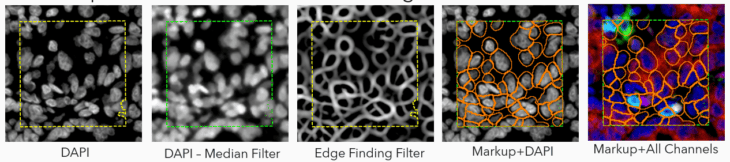
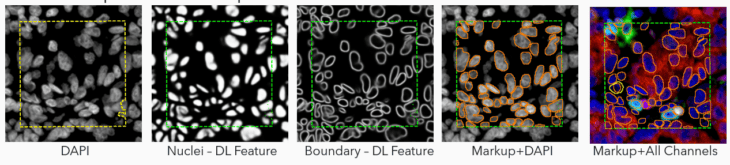
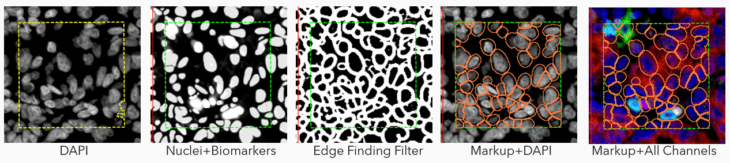
    In this study, Daniel Winkowski and team used Visiopharm’s image analysis software to explore three different approaches to segment cells in samples stained with different multiplexed fluorescent assays:

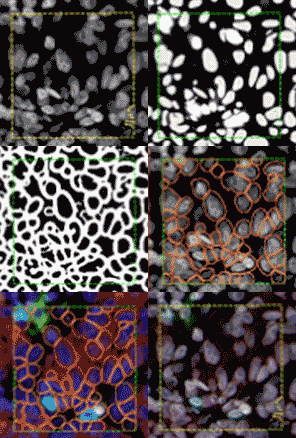
    1. Traditional Image Analysis (Trad): This method uses built-in filtering to enhance objects of interest, relying more on morphometry than intensity. While effective in identifying nuclei based on shape, it’s time-consuming and can struggle with diverse nuclear morphologies.

    2. Ready-To-Use Deep Learning (AI): This approach uses a deep learning algorithm for nuclear signals identification and segmentation. It estimates cell boundaries based on dilation – a no-hassle method but still an estimation. This approach can underperform in identifying cells with clear biomarker staining but lacking a clear nucleus in the plane of section (i.e., CD68 macrophages).

    3. Adapted Deep Learning (AI+): The real star of the show! This method augments the deep learning algorithm to include signals from biomarker channels, assisting in accurately delineating cell boundaries. This blend of nuclei and biomarkers, coupled with an edge-finding filter, offers a more precise approximation of the cell border and assists in finding complex cells (i.e,. macrophages, etc.) where nuclear identification methods fall short.

    Visiopharm offers a complete toolbox for design and customizing your own algorithm but also offers a general nuclear detection algorithm which uses Deep Learning AI to segment nuclei of most morphologies (Ready-to-use AI approach).

    To create the AI+ approach, the team adapted the ready-to-use algorithm to combine its nuclear AI classifier with signals from biomarkers in the multiplex panels to expand the segmentation beyond the nuclei, to the outer cell periphery.

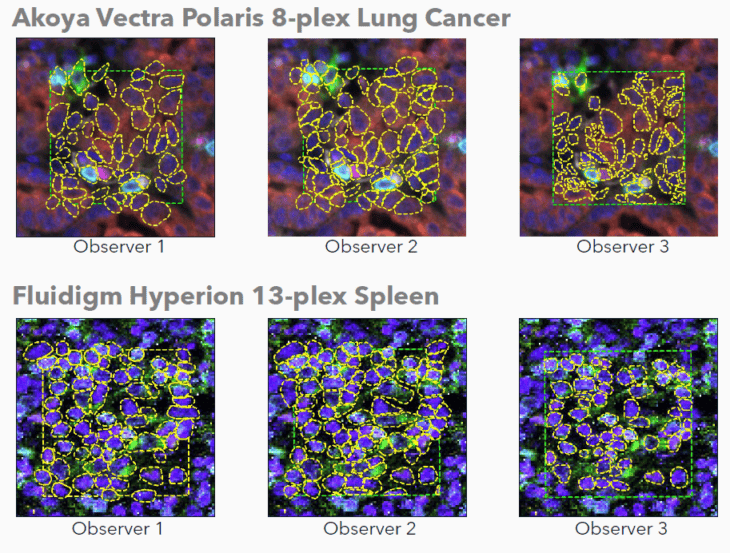
    The performance of these approaches was quantified by comparing them with manual annotations as a ground truth.

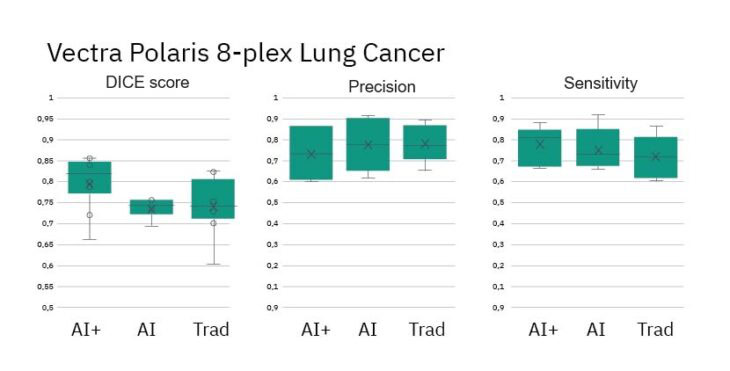
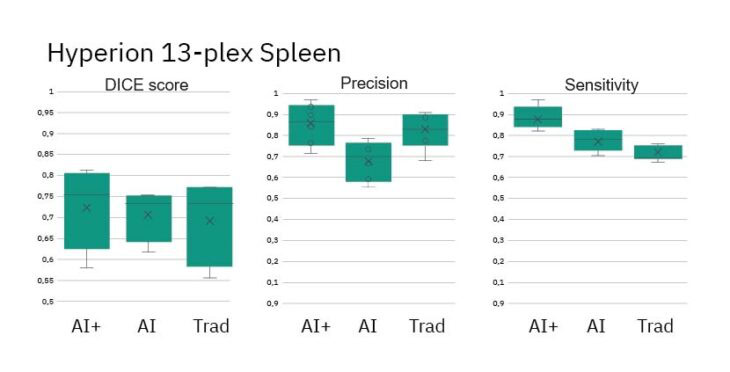
    Ground truth annotations were prepared by three human observers on images from two different instrument manufacturers: Vectra Polaris 8-plex lung cancer (Akoya Biosciences) and Hyperion 13-plex spleen (Standard BioTools).

    The AI’s performance was assessed against the ground truth annotations using Precision (a ratio of true and false positives), Sensitivity (a ratio of true positives and false negatives), and DICE Score (a ratio of all true/false, positive/negatives).

    Results: AI+ Takes the Lead 

    After rigorous testing against manual annotations (the ground truth), the results were clear. While all algorithms performed admirably, the AI+ method showed the highest concordance with ground truth annotations. This means a more complete and accurate segmentation of cells across varying multiplex images.

    • DICE Scores for AI+ method show improved performance vs Ground Truth
    • Precision and Sensitivity (measures of object detection) are similar across methods
    • DICE Scores for all methods show similar performance vs Ground Truth
    • Precision and Sensitivity (measures of object detection) are roughly equal across methods

    The Visiopharm has developed a flexible, AI-based strategy enabling comprehensive cell segmentation across various multiplex images.

    • All algorithms performed at a high-level using industry standards including DICE Scores, Precision and Sensitivity. 
    • The Adapted Deep Learning algorithm showed highest concordance with Ground Truth annotations.
    • Performance differences across instruments could be attributed to resolution differences of the instruments, the number of biomarkers in the panel, and differences in images tissue and disease state.
    • Despite annotation differences among human observers, the algorithms perform consistently across the image set.

    Would you like to see how Visiopharm’s software could support your cell segmentation challenges in multiplexed images? Learn more about Phenoplex, a complete workflow for all your multiplexed image analysis needs.