Blog

  • What Is a Hot-Spot and Does It Matter?

    The importance of hot-spots

    As discussed in the recent post on managing tumor heterogeneity, it is widely considered best practice to determine the Ki-67 proliferative index in a hot-spot of biomarker expression. A growing body of scientific evidence support that correct identification of hot-spots is essential to achieve sufficient interpretive accuracy for predictive and/or prognostic use [1,2]. Hot-spot scoring has recently been adopted in both Swedish and Danish clinical guidelines for breast cancer [3,4].

    Heterogeneity is a general challenge

    Heterogeneity with respect to expression levels is evident for many tissue biomarkers. Although it may be less obvious how to technically determine heterogeneity and hot-spots for membrane markers, or markers that express in several sub-cellular compartments, it is likely that the ability to visualize and quantify heterogeneity and identify hot-spots will be generally important to cancer research, drug development, biomarker validation, and in diagnostics. To further explore this, we developed a general research tool for quantification of tissue biomarkers, including generation of heatmaps of expression and identification of hot-spots..

    The definition of a hot-spot

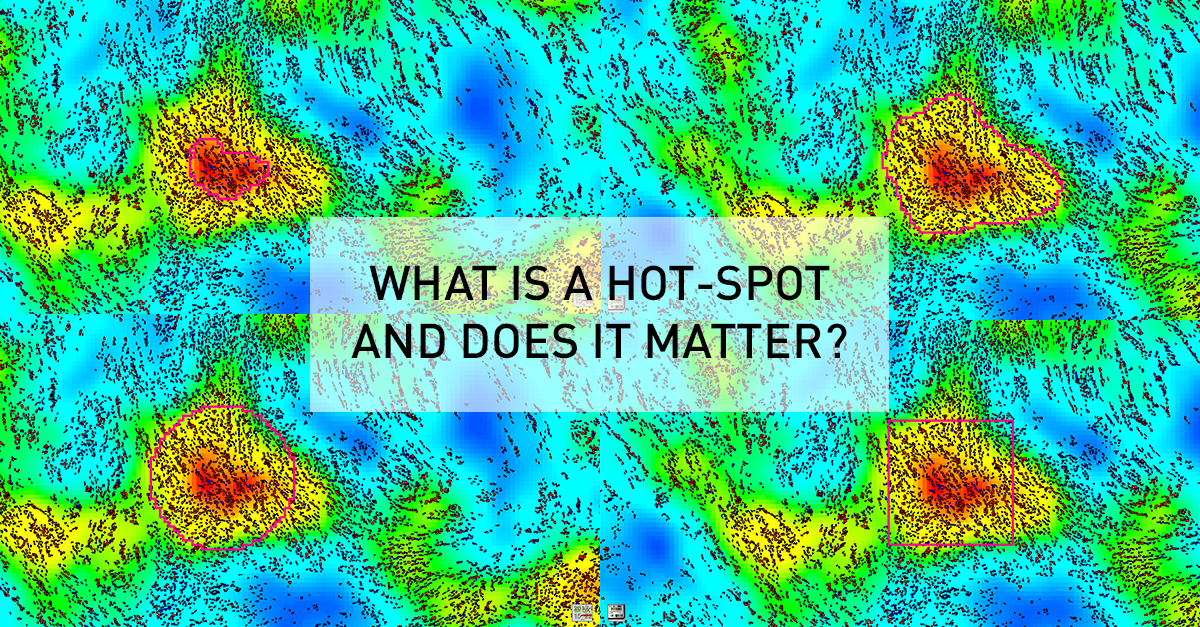
    As an example, this general research tool was used to create an APP for visualizing heatmaps for Ki67 expression across entire tissue sections, and determine the location of hot-spots. Although this seems an intuitively appealing approach for managing heterogeneity, it generates new questions relating to the definition of a hot-spot. Clinical guidelines are usually defining a hot-spot as a square of fixed dimensions, or recommend counting a certain number of cells around the hot-spot. For their presentation at the 29th European Congress of Pathology, Omanovic and Schönauwere comparing five different approaches to defining a hot-spot as outlined in the figure below. Note how the hot spot location and area changes between methods, and that heatmap area and count can be defined along the iso-curve of the biomarker response.
    Need for a standardized approach

    In the study above, they found that different definitions as well as area of hot-spots has a statistically significant impact on the proliferation index. Therefore, the fact that different guidelines and hot-spot definitions are adopted in clinical practice and for research purposes, also means that results cannot be compared. Thus, it will difficult to define generally applicable clinical standards (e.g. cut-offs) until there is a consensus on a unified / optimal definition of a hot-spot.

    Clinical relevance

    Apart from the need for standardization, there is also a need to understand to the impact of the observed differences on the predictive or prognostic power of tissue-based assays. At Karolinska University Hospital, Johan Hartman et. al. are currently exploring this in a study design with a longitudinal cohort, clinical outcomes and access to sequencing data. The outcome of this study will hopefully provide insights allowing for a recommendation of an optimal definition of hot-spots, for understanding the impact on diagnostic/prognostic accuracy, and to what extent a modern tissue-diagnostic approach provide statistically independent information compared to molecular methods. 

    References:

    ​1.Stålhammer et. al.; Digital image analysis outperforms manual biomarker assessment in breast cancer; Modern Pathology 29, 318-329 (2016)

    2.Gudlaugsson et. al.; Comparison of the effect of different techniques for measurement of Ki67 proliferation on reproducibility and prognosis prediction accuracy in breast cancer

    3.KVAST, Swedish breast cancer guidelines, 2018 (in Swedish)

    4.DBCG – Danish Guidelines, May 2017 (in Danish).

  • Managing Tumor Heterogeneity for Quantification of Biomarker Response

    Tumor heterogeneity in research and diagnostics


    Diagnostic pathologists and scientists often rely on tissue data for important diagnostic-, research-, or even business- decisions. One of the major concerns relate to tumor heterogeneity in the context of quantifying tissue biomarker response. Questions revolve around how to reliably visualize, quantify, and in practical terms deal with heterogeneity.

    The impact of heterogeneity on diagnostic accuracy​


    Concerns are apparently well founded. In a recent publication, Stålhammer et. al. [1] demonstrated that manual stratification of breast cancer patients into Luminal A vs. Luminal B based on Ki67 was associated with an error rate of 31%. Using image analysis with computer identified hot-spots reduced the error rate to 19%, when using PAM50 as a pseudo gold-standard.

    Heterogeneity and hot-spots


    What really made the difference in reducing error rates, was automated identification of hot-spots, using image analysis. Gudlagsson et. al [2] showed that as much as 50% of pathologists were unable to correctly identify the hottest hot-spot which, in some cases, can represent a major cognitive challenge. This challenge was effectively mitigated using image analysis.

    Diagnostic applications


    As a first practical diagnostic application, we considered automated hot-spot identification for Ki67 expression in breast cancer. By creating heat maps of biomarker expression, the intended use of the APP is to support pathologists in both visualizing heterogeneity and locate the hottest hot-spot (s). This can be used as input to APPs that quantify biomarker expression in the hot-spot(s). CE-marking for In-Vitro Diagnostic purposes, required special attention to the study designs for validating clinical performance.

    Research applications


    The challenges related to heterogeneity may well be further amplified when interrogating far more complex, and sometimes multiplexed, biomarkers across the entire tumor micro-environment. With Oncotopix® Author, the ability to visualize and quantify heterogeneity wrt. biomarker response has been generalized for tissue-based cancer research.

    Click here to learn more about the CE-IVD Hot Spot APP.

    Download the Hot Spot brochure

    References​

    1.Stålhammer et. al.; Digital image analysis outperforms manual biomarker assessment in breast cancer; Modern Pathology 29, 318-329 (2016)

    2.Gudlaugsson et. al.; Comparison of the effect of different techniques for measurement of Ki67 proliferation on reproducibility and prognosis prediction accuracy in breast cancer

  • Akoya Biosciences as an Authorized Reseller

    Visiopharm Announces Akoya Biosciences as an Authorized Reseller of Oncotopix® Discovery and Biotopix™

    Visiopharm A/S announced today a partnership with Akoya Biosciences, the technology leader in multiplexed immunofluorescence including the Phenoptics™ portfolio with the Vectra® and Vectra Polaris® systems. As part of this agreement, Akoya becomes an authorized reseller of Visiopharm’s suite of image analysis software, including Phenomap™ and the teach-by-example Artificial Intelligence (AI) modules.

    Visiopharm is very pleased to have Akoya Biosciences join our partner and authorized reseller community. Our complementary technologies enable scientists and pathologists to better interrogate the disease biology through biomarker discovery and automated cell phenotyping within tissue samples. Our joint customers will benefit from two companies who are committed to driving innovation and providing solutions that deliver efficiency, standardization, and the reproducibility required to support large scale translational studies from discovery through clinical research” said Amanda Lowe, Senior Vice President of Visiopharm.

    Akoya recently announced the acquisition of the Phenoptics portfolio from PerkinElmer, Inc., to complement the CODEX® platform for ultra-high multiplex capabilities. The enables analysis of multiplexed image data from the Mantra®, Vectra and Vectra Polaris platforms with future development for the CODEX technology.

    Akoya’s focus is to provide customers with end-to-end solutions for high parameter tissue analysis that includes multispectral imaging instruments, reagents, and powerful software.” said Terry Lo, President at Akoya Biosciences. “We are excited to be able to add software like Visiopharm’s Phenomap to our current portfolio and offer Akoya customers the best and broadest solutions in the field of multiplexed immunofluorescence and tissue analysis.

    The partnership with Akoya will cover both North America and Europe and support our joint vision of providing customers with a full suite of powerful image analysis solutions for high-dimensional, multiplex tissue assays.

    Visiopharm will present Phenomap, AI, and our infinitely configurable suite of image analysis software at Pathology Vision’s (booth #214) in San Diego on November 5th and 6th and at Society of Immunotherapy in Cancer (booth #223) on November 8th – 11th in Washington DC.

  • Deep Learning Methods Powered by AI in Tissue Image Analysis

    CIO Applications recently sat down with our founder and CEO Michael Grunkin. The technology print magazine focuses on usage of various tech s

    From tedious manual annotation work to fully automated annotations with a streamlined image analysis workflow. This is now possible with AI tools that are remarkably accurate generating powerful results within tissue segmentation, cell identification, quantification and other cell-based tasks.


    AI expands the possibilities in cancer research and diagnostics


    Whether you are looking for nuclei quantification in IHC images, accurate tumor separation in H&E, or advanced context aware region mapping in brain images, Oncotopix®/Biotopix™ AI image analysis is your go-to toolbox. Deep neural networks bring virtually endless possibilities to augmented pathology.

    AI made easy

    The Oncotopix®/Biotopix™ AI platform is train-by-example image analysis for digital pathology, made easy-to-use. Deep learning convolutional neural algorithms are trained based on easily annotated training data provided by you as the user. AI is not magic – you are in control of the learned behavior.

    Patented virtual double stain (VDS)

    Are you already using Artificial Intelligence (AI) for image analysis in digital pathology, and have you experienced the time-consuming task of annotating enough training data to capture the variance in your images? Let Visiopharm introduce you to our unique patented Virtual Double Stain (VDS) method for automatic annotation of training data.

    AI redefines what is possible in image analysis

    In more advanced cases robust identification of morphologically and/or functionally distinct features in histological samples, such as glomeruli in the kidney, compartments of the brain, and tumor/stroma separation, continues to challenge traditional image analysis methods. Differences in disease severity; preanalytical variables, such as variance in staining intensity; and structures or regions reliant solely on context often result in tedious manual annotations to achieve necessary accuracy.

    Stefan Hamann, PhD from the Translational Pathology Laboratory at Biogen has utilized Visiopharm’s context-based deep learning algorithms to automate the laborious manual tissue annotation process. The task involved sagittal mouse brain sections with 6 regions-of-interest. The result is a fully automated mouse brain annotation tool that is remarkably accurate when confronted with unique tissue artifacts, illuminating the possibilities of deep learning within a streamlined image analysis workflow.

    Visiopharm’s AI webinar

    Watch our webinar to experience Oncotopix®/Biotopix™ AI image analysis with real-life applications, where Visiopharm’s deep learning experts demonstrate the “how to” with explanations and relevant demo cases.

    Visiopharm AI image analysis solution


    The Oncotopix® and Biotopix™ AI image analysis modules are available and fully integrated with the Visiopharm current image analysis software platform. Visit visiopharm.com/ai-deeplearning

    Visiopharm AI Image Analysis in the news

    Please see the launch news at TissuePathology: Keith Kaplans Digital Pathology Blog

  • Visiopharm & Fuidigm Co-promote Phenomap Image Analysis Software & Hyperion Imaging System

    Fluidigm Announces Co-Marketing Agreement with Visiopharm to Expand and Simplify Imaging Mass Cytometry Data Analysis

    Visiopharm Multiplex software presented at the Fluidigm Imaging Mass Cytometry User Group Meeting, expanding the suite of Hyperion Imaging System data analysis tools for translational and clinical research 

    Fluidigm Corporation (NASDAQ:FLDM) and Visiopharm A/S today announced a co-marketing relationship to automate image analysis for Imaging Mass Cytometry™ (IMC™). Under the terms of this agreement, Fluidigm and Visiopharm will cooperatively promote Visiopharm® image analysis software in conjunction with the Fluidigm® Hyperion™ Imaging System, MCD™ Viewer software and related Maxpar® antibodies and kits.

    Developed using proven Fluidigm CyTOF® technology, the Hyperion Imaging System surpasses the inherent limitations of fluorescence detection by using highly pure metal tags that are separated by mass instead of by wavelength. Setting a new standard in highly multiplexed protein detection, the system enables researchers to simultaneously detect up to 37 markers from a single tissue section by IMC. Providing comprehensive analysis of cellular phenotypes and their interrelationships within the spatial context of the tissue microenvironment, IMC is aiding researchers around the world to uncover meaningful new insights in health and disease.

    We are committed to maximizing the full potential of mass cytometry to deeply interrogate tissue and tumor samples,” said Chris Linthwaite, President and CEO of Fluidigm. “Today we are excited to announce our agreement with Visiopharm, a leader in quantitative digital pathology software solutions. Together with Visiopharm, we are proud to bring new software capabilities to our growing IMC community.

    On September 11, Visiopharm will present its Multiplex software at the Fluidigm Imaging Mass Cytometry User Group Meeting in Seattle. Developed as an expansion of the Oncotopix® Discovery platform, Multiplex enables researchers to perform automated analysis of images generated by the Hyperion Imaging System. Offered as a licensed software solution from Visiopharm, Multiplex provides automated cell segmentation and phenotyping of cell classes in addition to powerful visualization of cell populations with phenotypic charting and t-SNE clustering.

    “The collaboration between Fluidigm and Visiopharm will provide scientists novel tools to understand the biology of cancer, including the phenotyping of cells within the tumor microenvironment,” said Michael Grunkin, CEO of Visiopharm. “Our complementary technologies provide an entirely new research approach to drive drug-diagnostic co-development on a tissue-based platform, with the potential to also provide a new framework for precision medicine in cancer.

    Collaborating to provide high-value automated data analysis solutions for the Hyperion Imaging System is essential to our strategy to empower routine use of this powerful technology,” continued Linthwaite. “By introducing automation to the MCD™ Viewer analysis pipeline, Multiplex further expands the capabilities of the Hyperion Imaging System to advance our understanding of human disease and improve the future of care.

  • Visiopharm Becomes a Technology Leader in Deep Learning

    Visiopharm Becomes a Technology Leader in Deep Learning and AI Image Analysis for Digital Pathology

    Visiopharm Launches AI Powered by Deep Learning: Letting Pathologists Harness the Power of AI

    The Oncotopix®/Biotopix™ AI image analysis platform is powered by the latest technological breakthroughs in AI and Deep Learning, providing the most comprehensive solution for image analysis available for Digital Pathology today.

    With near infinite configurability, the Visiopharm AI software platform addresses even the most complex and challenging image analysis applications. This allows scientists and researchers to grow and evolve with their research without constantly hitting the walls of software limitations.

    The intuitive “teach-by-example” implementation, makes it possible for pathologists to easily become proficient and generate highly accurate and reproducible results even if they have no skills in programming or advanced IT.

    “Visiopharm really has become a leader in these types of deep learning methods which is really impressive” 

    – Robert Dunstan, Senior Research Fellow, AbbVie

    The deep learning technology in the Visiopharm AI image analysisplatform is specifically developed towards histopathology, so pathologists and scientists are able to apply, train and create high-quality deep learning algorithms to obtain breakthrough results in own field of work.

    “Our AI platform was designed for offering the latest breakthrough advances in AI/Deep Learning Technology for Whole Slide Image Analysis in a way that enables immediate productivity with very little training, also for scientists with no IT-background; while still offering full configurability for experts,” said Michael Grunkin, CEO of Visiopharm. “This makes Oncotopix/Biotopix AI the ideal platform for tissue-based research: Scientists can grow with their research without experiencing limitations and barriers. We are excited to see how easy it is for our users to efficiently tackle applications that they weren’t able to address with other tools”.

    “With these state-of-the-art deep learning algorithms optimized for tissue pathology, we see the second paradigm shift in AI for image analysis. We simply push the boundaries of what is possible in cancer research and drug development,” adds Jeppe Thagaard, deep learning research engineer, Visiopharm.

    With the new AI image analysis platform, pathologists and scientists get the power of state-of-the-art deep learning to solve difficult problems – without having to write a single line of code. 

    Watch Visiopharm’s AI webinar

    Take a look and watch Visiopharm’s deep learning experts demonstrate the “how to” with explanations and demo cases relevant for nuclei quantification in IHC images, accurate tumor separation in H&E, and advanced context-aware region mapping in fx brain images. 

    Watch the webinar here.

    Visiopharm AI Image Analysis solution 

    The Oncotopix® and Biotopix™ AI image analysis modules are available and fully integrated with the Visiopharm current image analysis software platform. Visit visiopharm.com/ai-deeplearning for details.